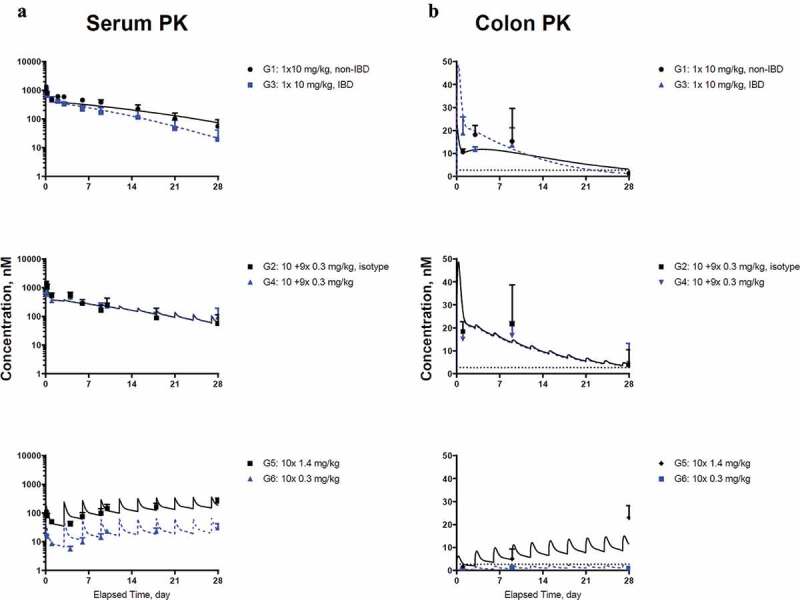
Figure 4.

Model fitting for (a) CNTO 5048 in serum; (b) CNTO 5048 in colon homogenate Symbols represent the observed data (mean±SD); solid black lines and blue dashed lines represent model fitting results. The LLOQ of CNTO 5048 in serum and colon tissue were 0.533 and 2.67 nM, respectively. LLOQ for colon shown in black dotted lines, while serum mean concentrations are above LLOQ for all groups and therefore the LLOQ for serum is not shown.
