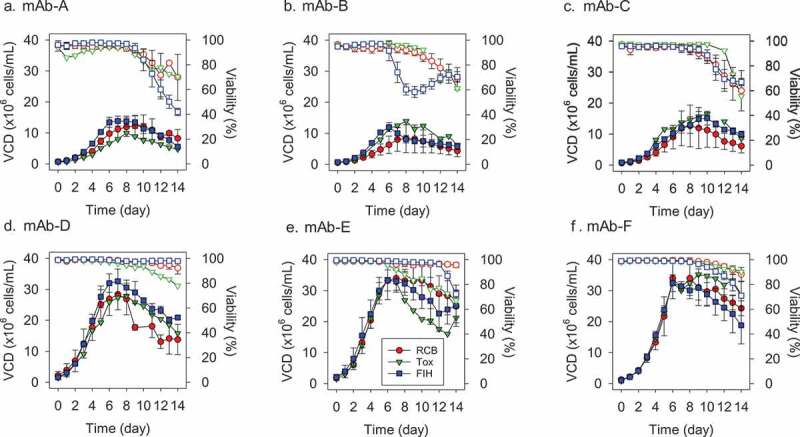
Figure 2.

Viable cell density (VCD) and viability profiles for six monoclonal antibodies (A-F: mAb-A to mAb-F) between RCB, Tox, and FIH stages. RCB was at 5 L scale with individual 6 clones (RCBs), Tox was at 200 L scale with a pool of 6 clones (RCBs), and FIH was at 1,000 L scale with the lead clone MCB. Two expression systems were used: mAb-A, B, C with a CHO DG44 system, mAb-D, E, F with a CHO K1 system. RCB: Research Cell Bank; MCB: Master Cell Bank; FIH: First-in-Human. Solid symbols represent VCD profiles and open symbols represent viability profiles. For RCB, error bars represent the spread of all 6 clones (n = 6). For FIH, error bars represent one standard deviation of multiple FIH batches (n = 3–6). Only one batch was produced for Tox (n = 1).
