
Figure 4.
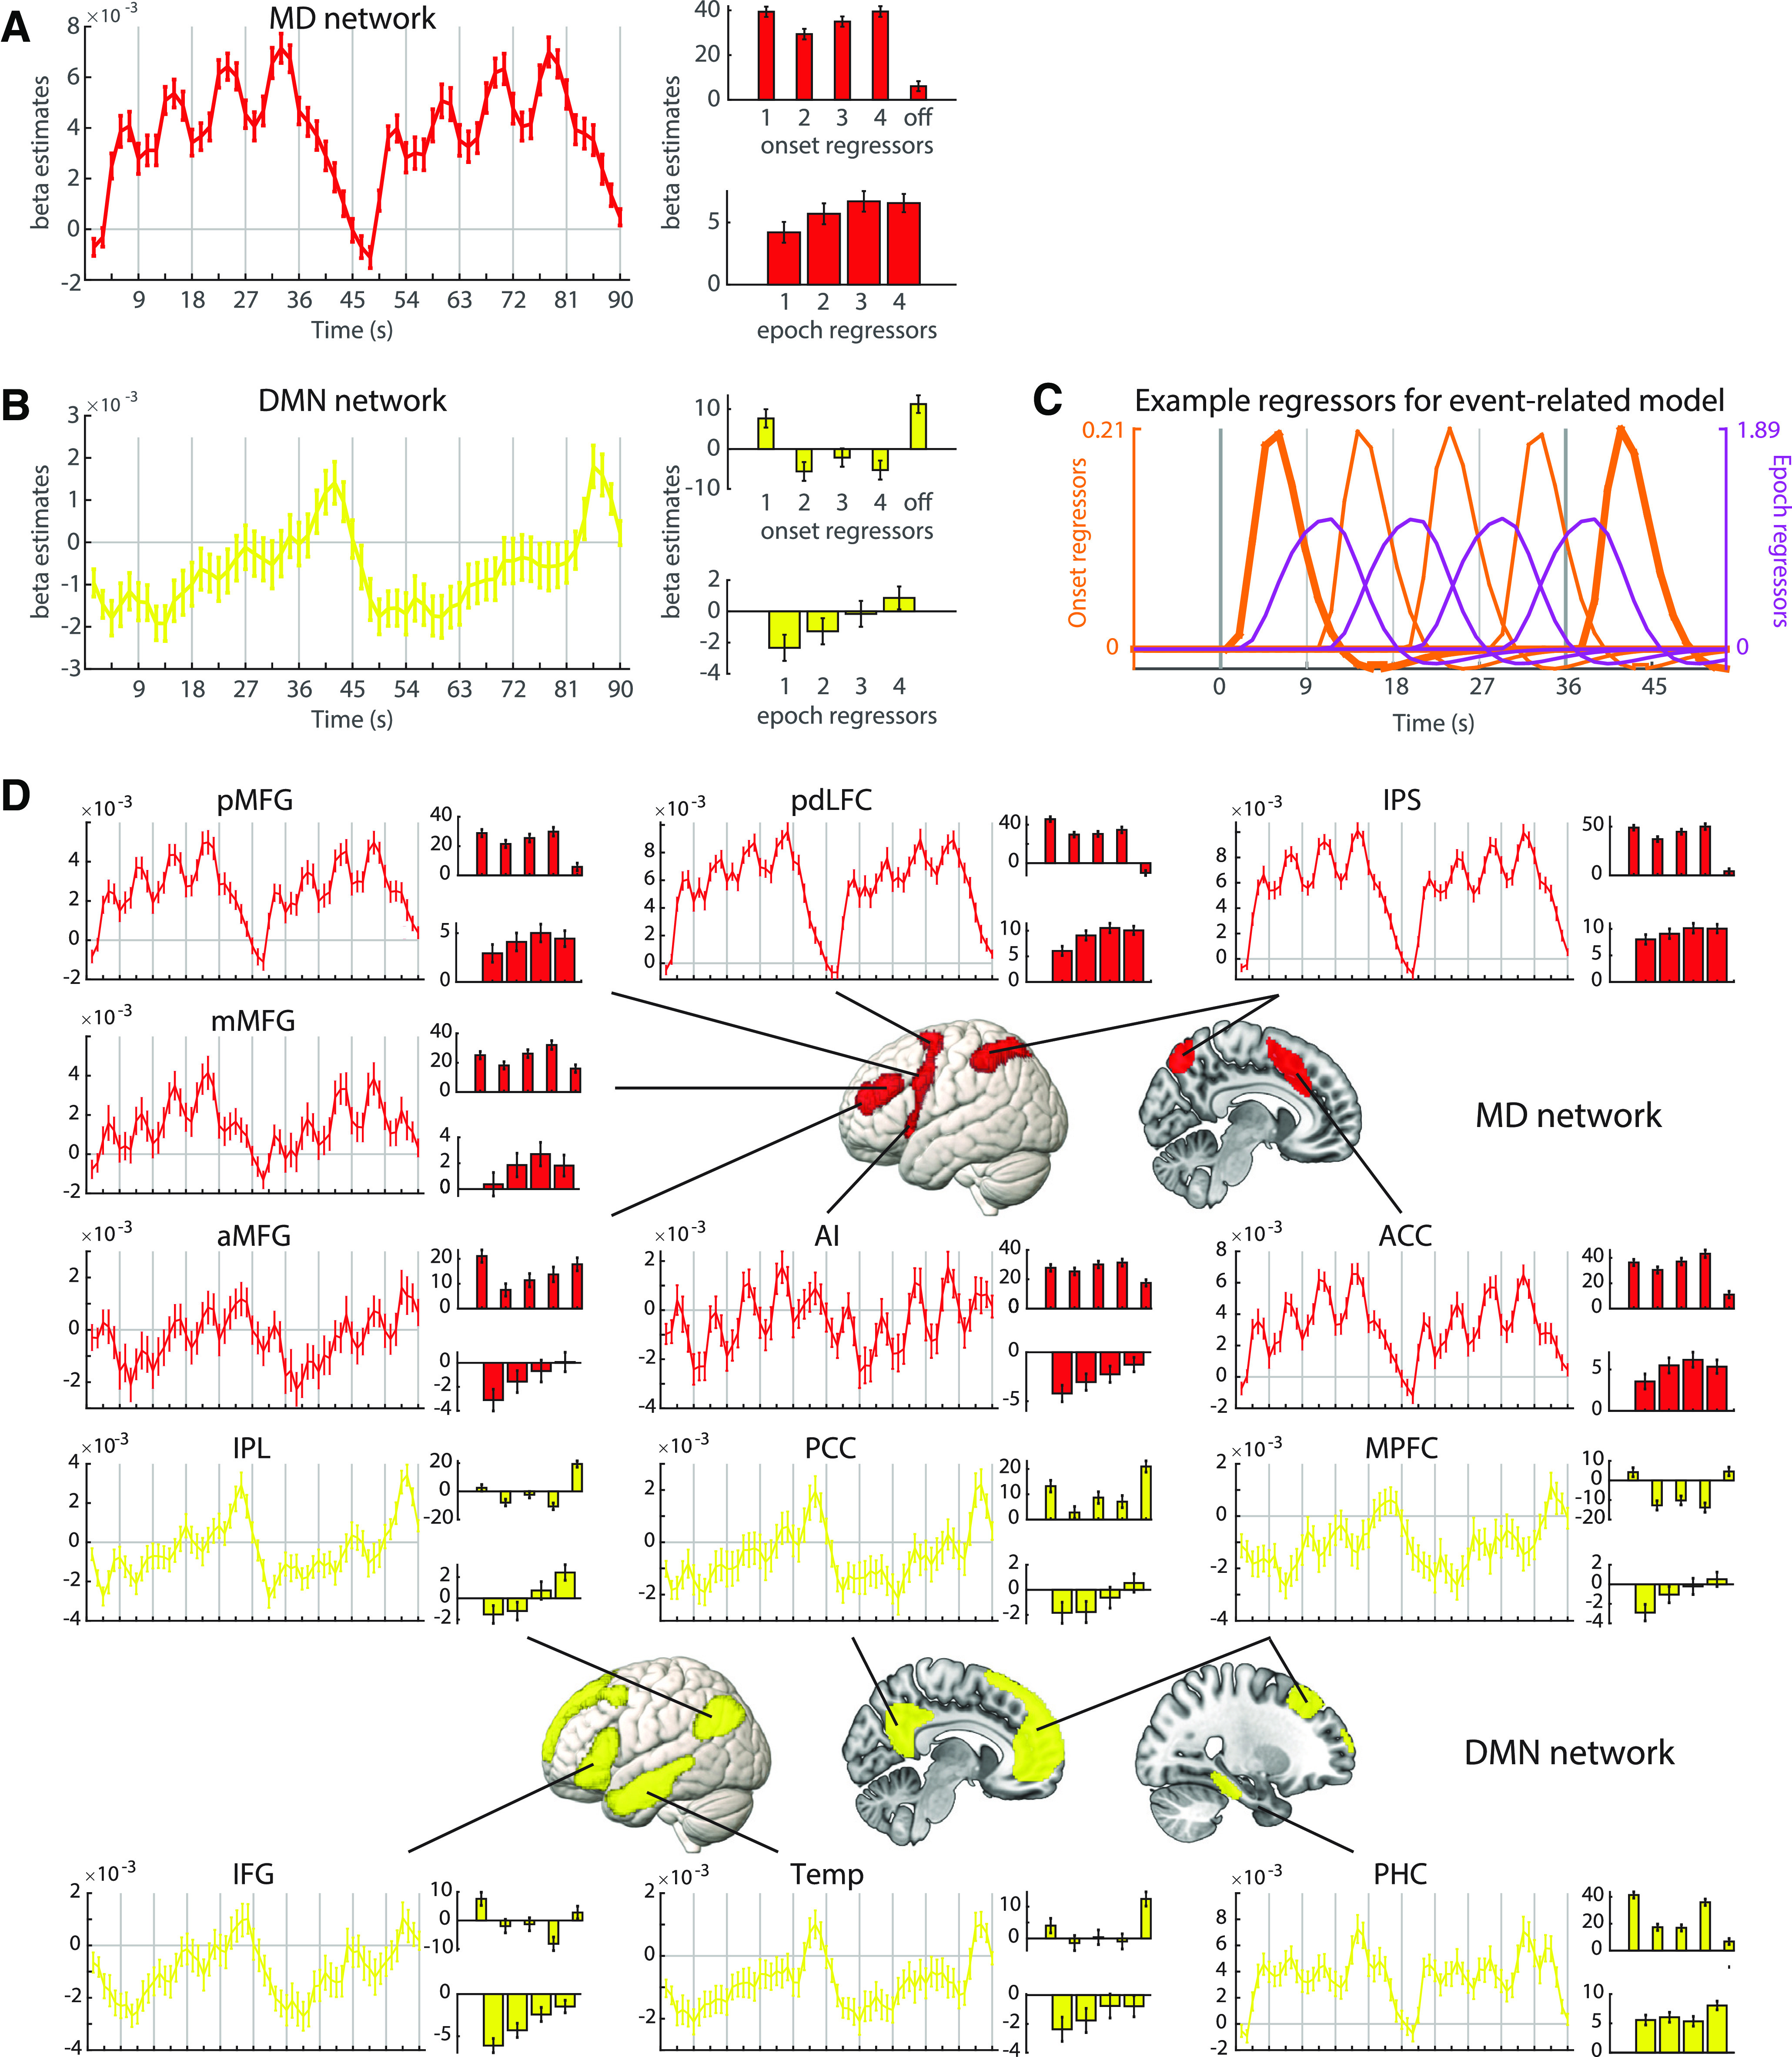
Univariate ROI analysis of MD network (A) and DMN (B) BOLD response across task episodes. For each network, the left plot shows results of the FIR analysis, with BOLD response as a function of time as participants progressed across two consecutive episodes. The upper right plot shows β estimates associated with step onset regressors (bars 1–4), and with the end of the episode (bar “off”). The lower right plot shows β estimates for epoch regressors per step. Error bars indicate SEM. C, Example regressors modeling the transient onset/offset responses (orange) and the sustained epoch responses (purple) to each step within an episode. Vertical gray lines mark the beginning/end of each step. Thicker gray lines indicate episode boundaries; thicker orange lines indicate responses to these episode-boundary transitions. D, FIR time-courses and activation profiles of onset and epoch responses in individual ROIs within the MD network (red) and DMN (yellow). The layout is the same as panel A. aMFG/mMFG/pMFG: anterior, middle, and posterior middle frontal gyrus; pdLFC: posterior-dorsal lateral frontal cortex; IPS: intraparietal sulcus; AI: anterior insula; ACC: anterior cingulate cortex; IPL: inferior parietal lobule; PCC: posterior cingulate cortex; MPFC: medial prefrontal cortex; IFG: inferior frontal gyrus; Temp: lateral/anterior temporal cortex; PHC: parahippocampal cortex. For all panels, note that activation values associated with the FIR, onset, and epoch regressors are in arbitrary units as their scale depends on the regressor height.