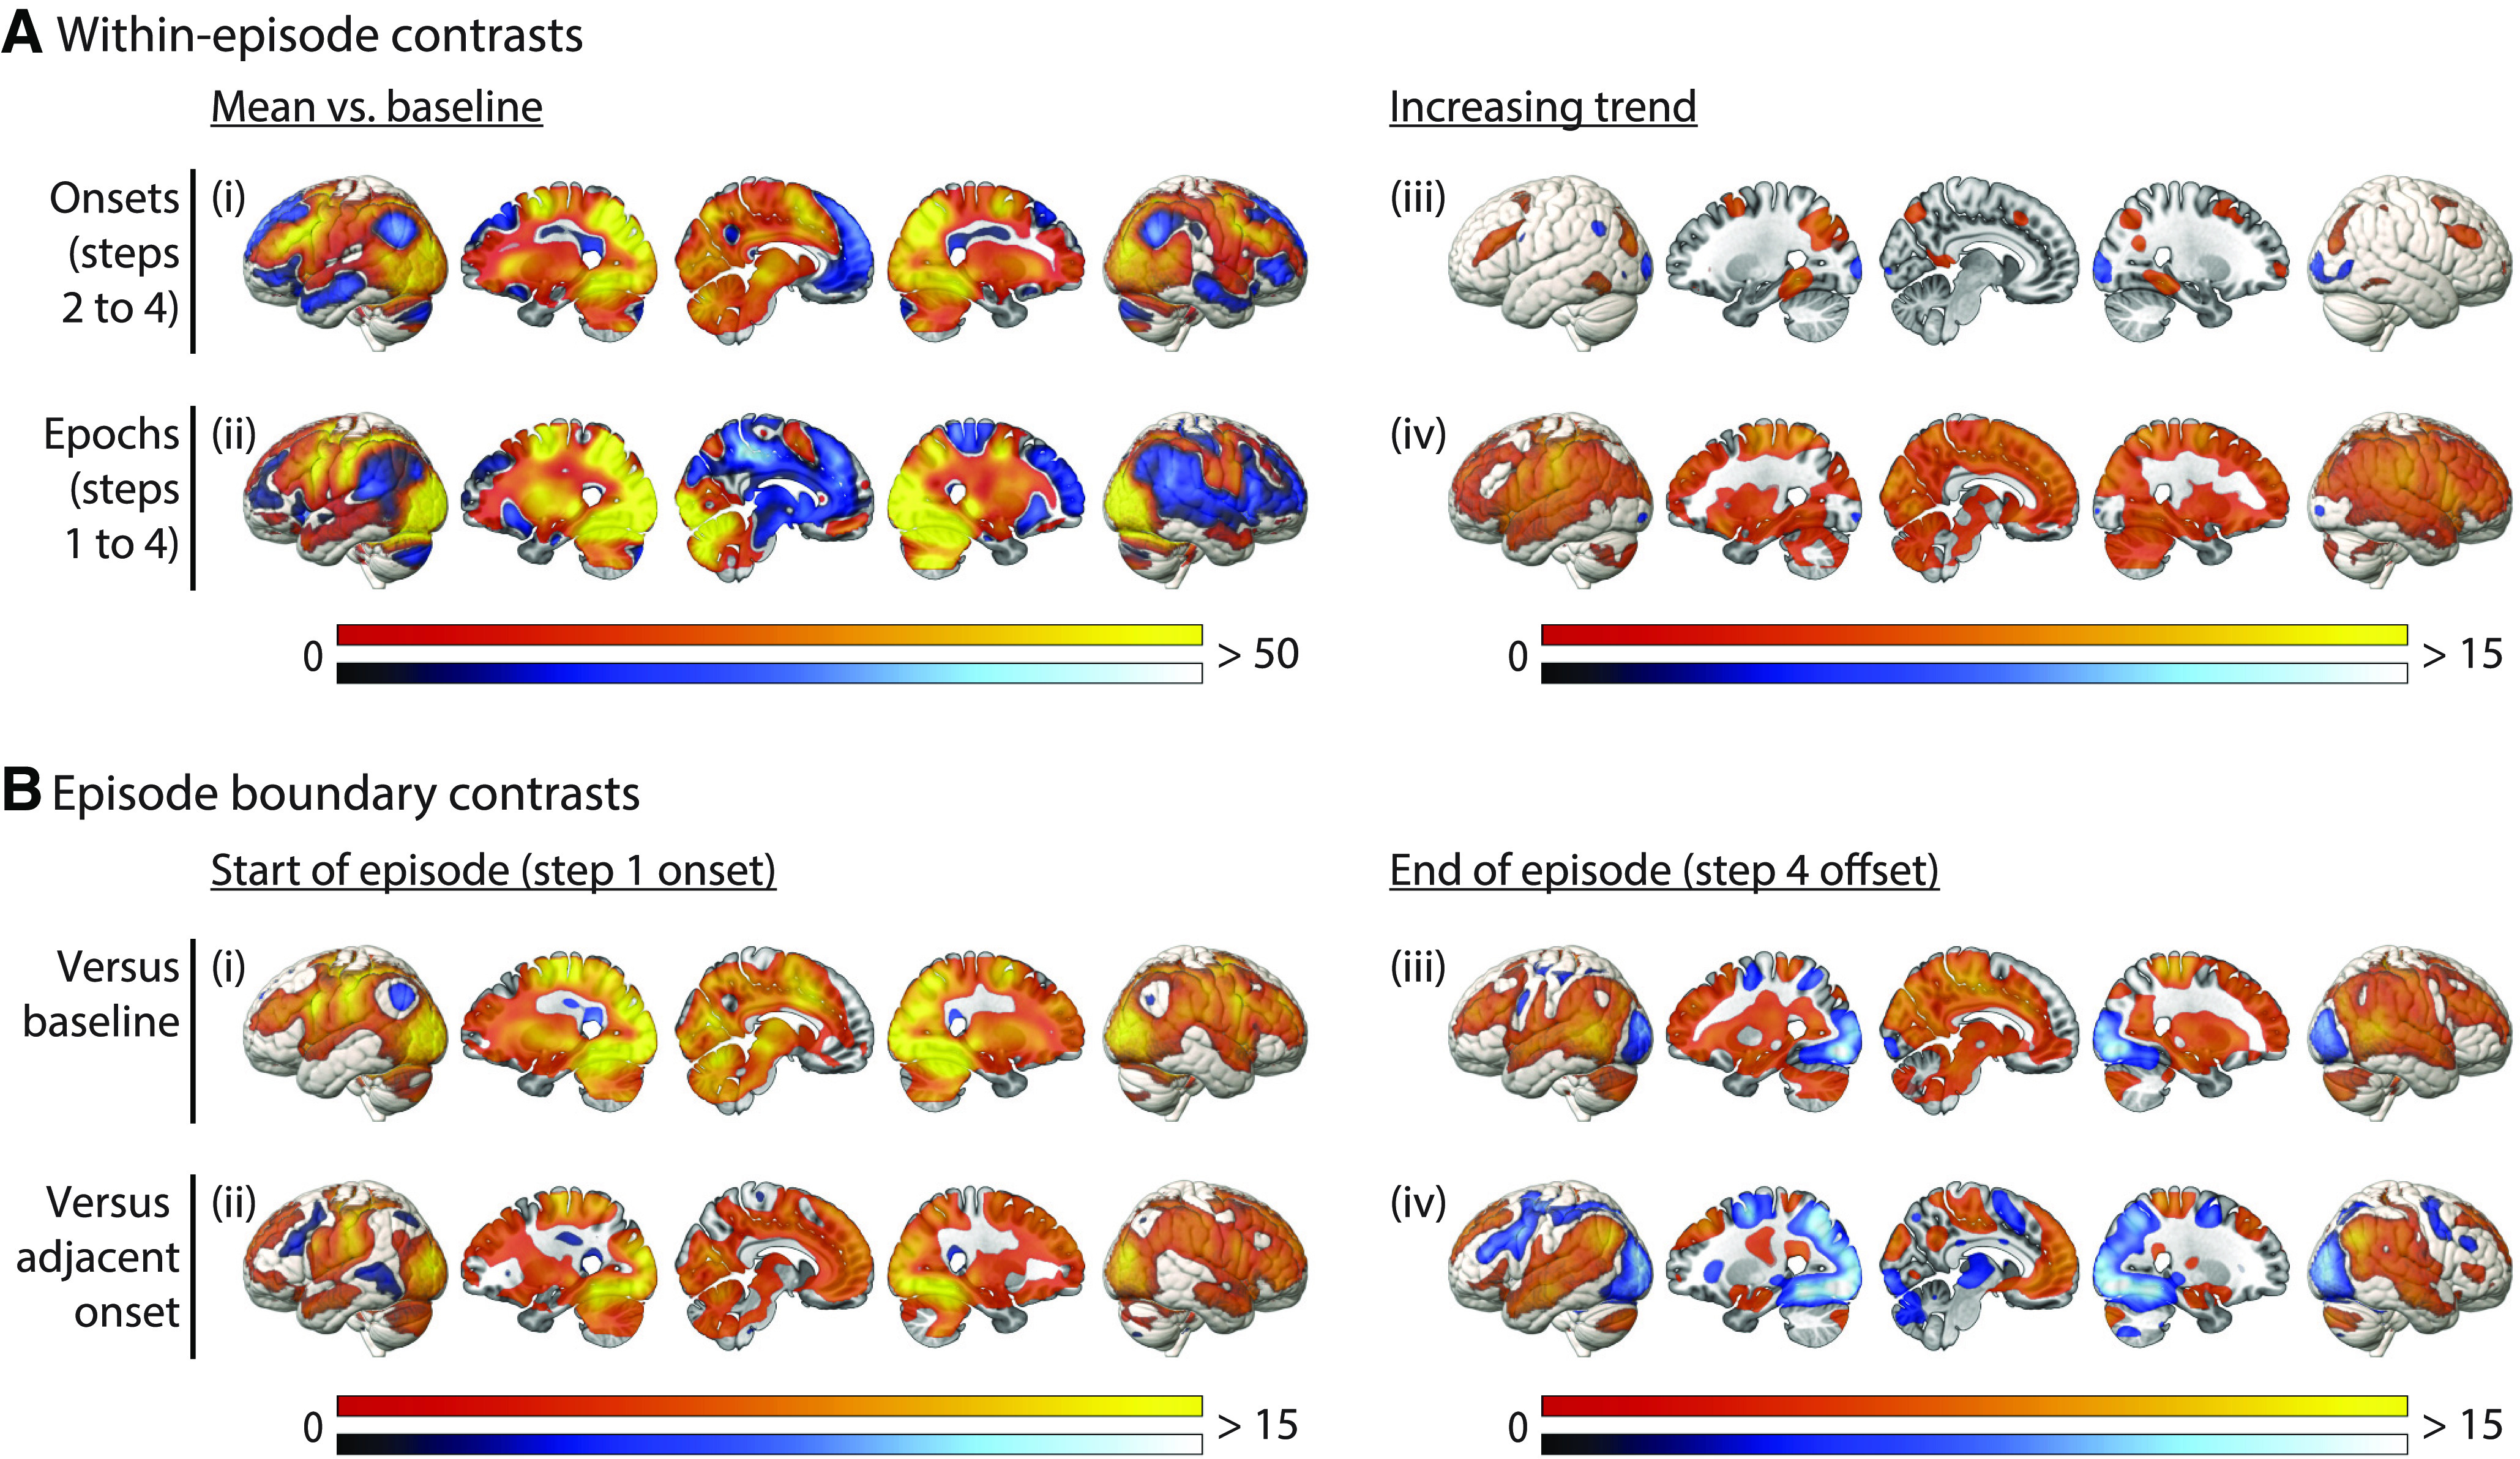
Figure 5.

Whole-brain univariate analysis. A, Responses within an episode, including (i) mean phasic responses to the onset of each step; (ii) mean tonic responses across the duration of each step; (iii) increases in the phasic response across step onsets; (iv) increases in the tonic response across step epochs. B, Transient responses at episode boundaries, including (i) episode onset versus baseline; (ii) episode onset versus step 2 onset; (iii) episode offset versus baseline; (iv) episode offset versus step 4 onset. Colors indicate t values, with warm and cool scales indicating positive and negative tails, respectively. All activation maps are thresholded at FDR < 0.025 per tail.
