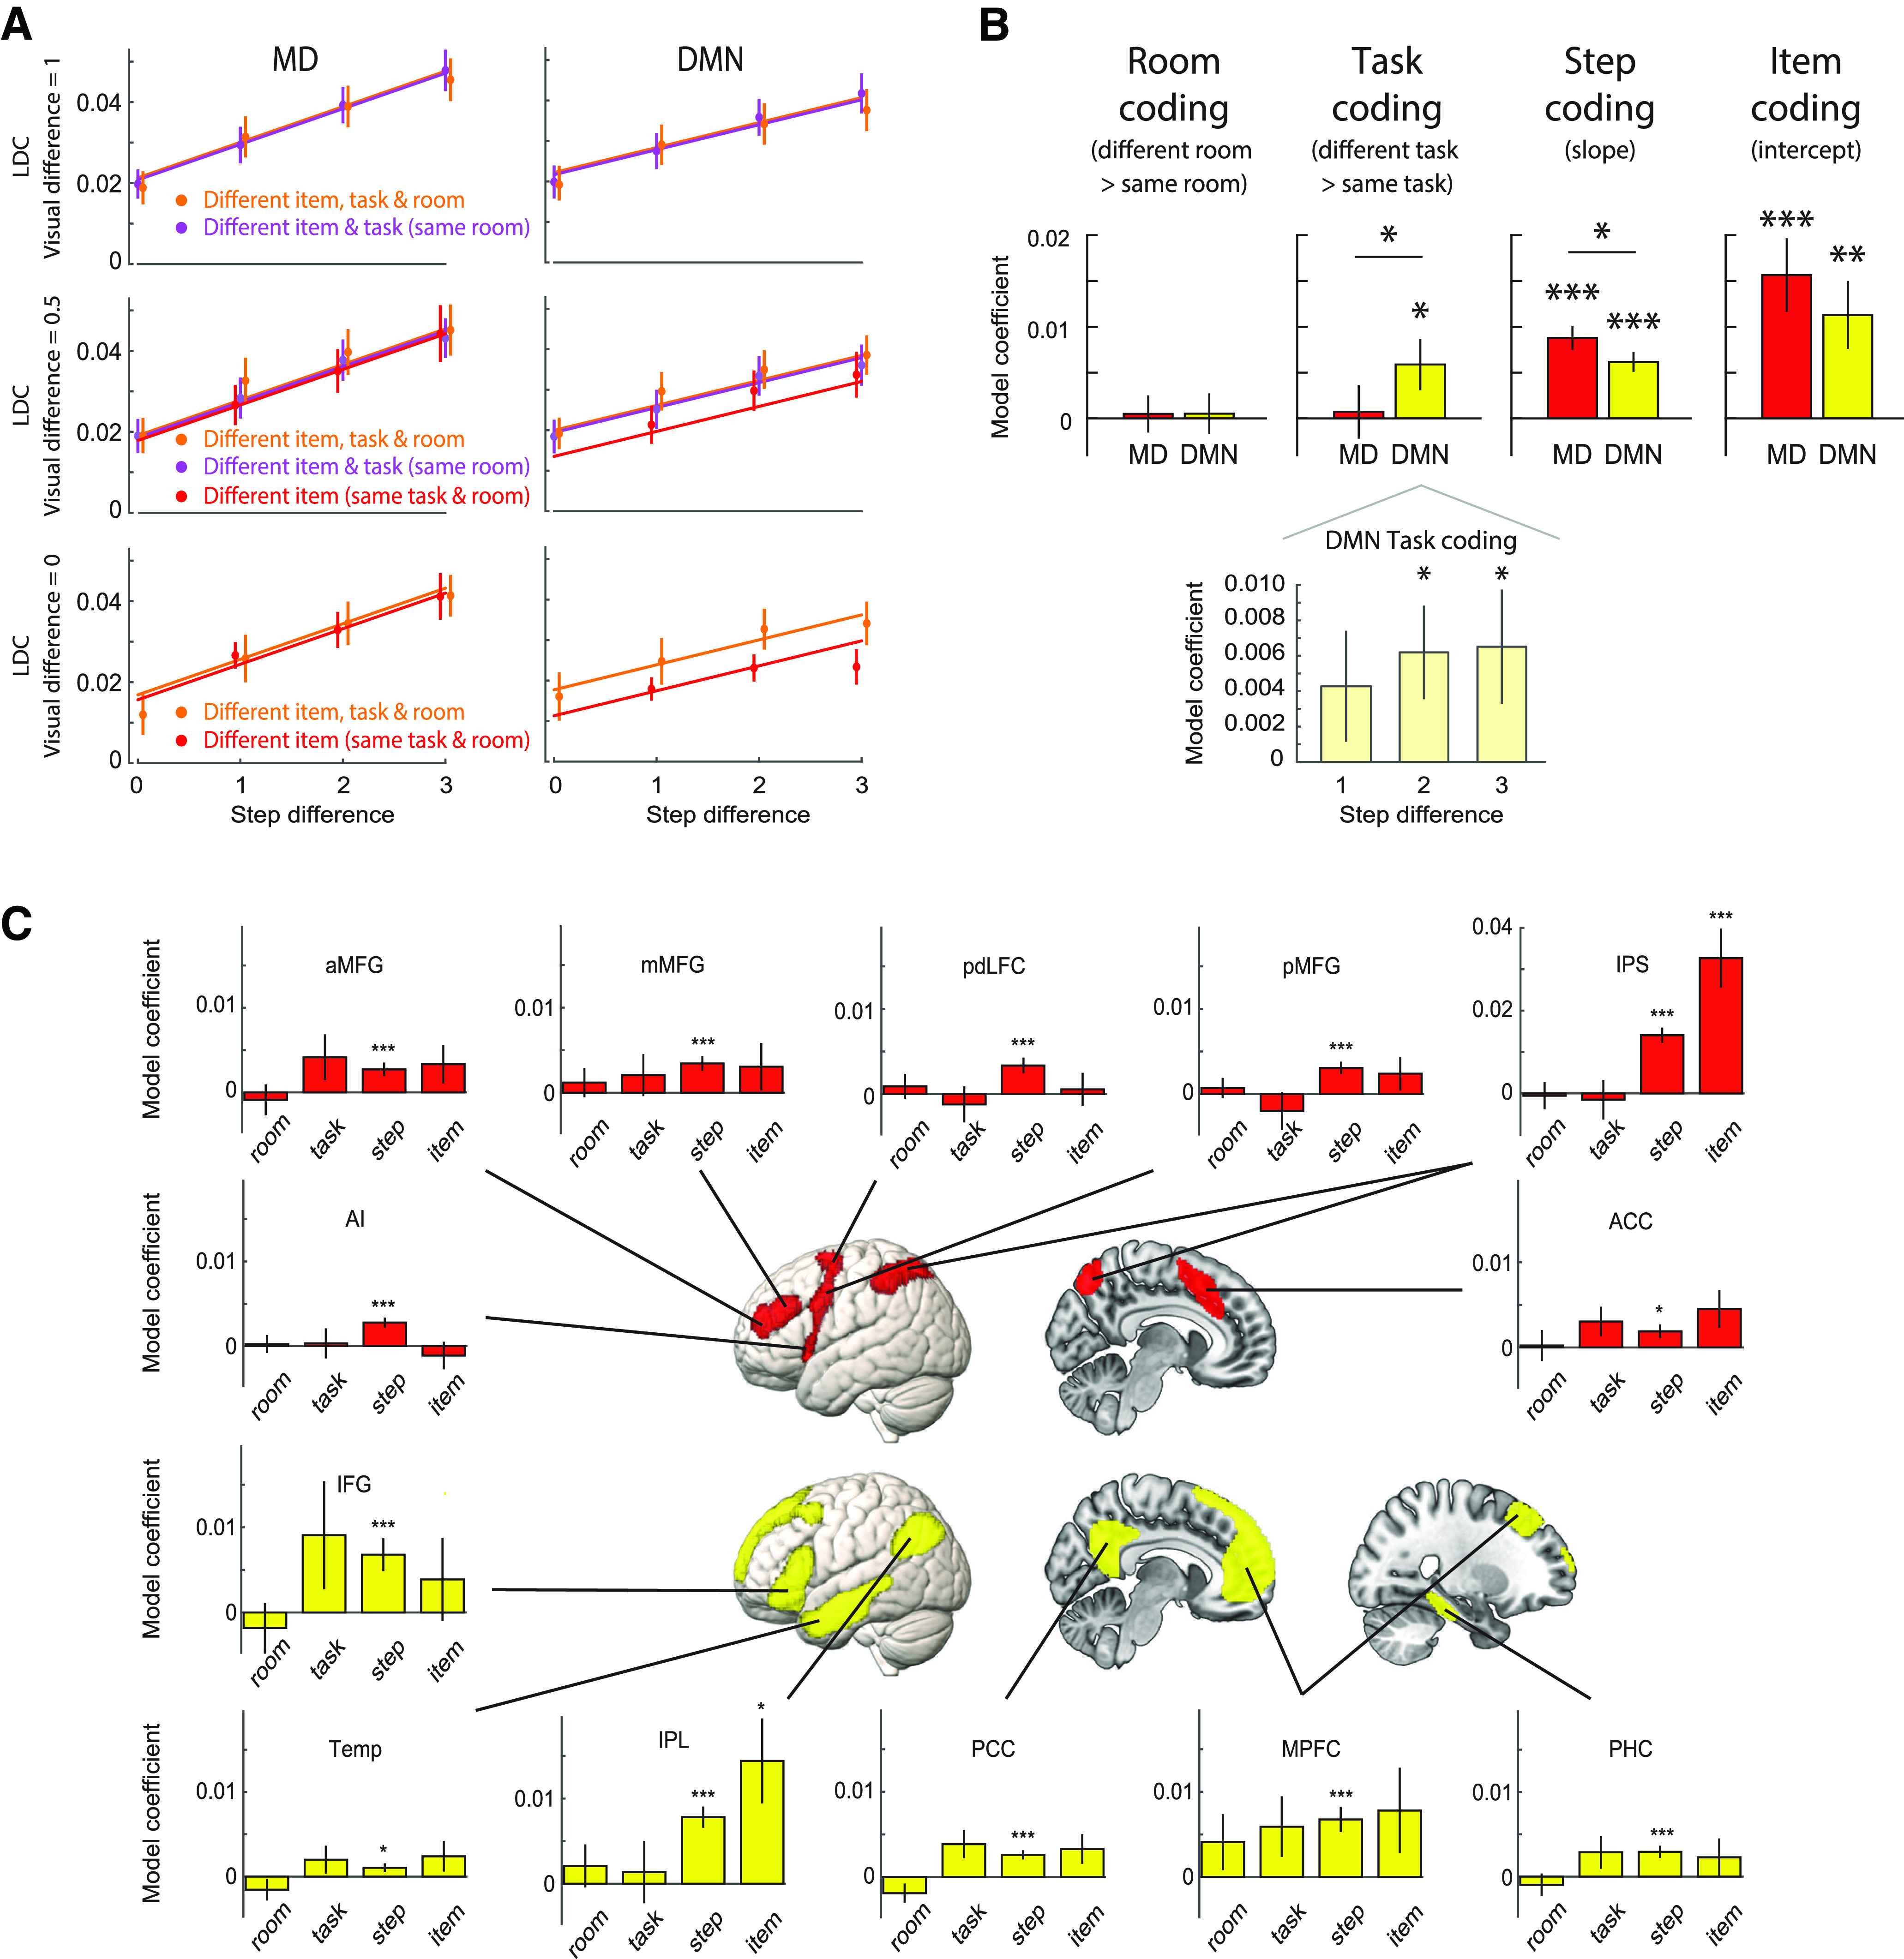
Figure 6.

A, LDC representational distance estimates, modeled as in Figure 2B. Data points are plotted separately for different levels of visual difference (Fig. 2C) and are offset fractionally along the x-axis for visibility. Lines represent the mean linear model fit, estimated using all data (except matched-item comparisons). Visual difference = 0: displays based on items from same two tasks; difference = 0.5, one shared task; difference = 1, no shared tasks. Note that pairs from the same cued task (red) necessarily shared display items from at least one task (no data in top row), while different-task same-room pairs (purple) never shared items from two tasks (no data in bottom row). B, top, LDC contrasts representing strength of room, cued task, step, and item representation in DMN and MD network-level ROIs. Asterisks above each bar indicate significance of one-tailed t tests against zero, after controlling FDR <0.05 across ROIs; horizontal lines indicate a significant two-tailed paired t test between networks. Bottom, Task representation broken down by step difference in the DMN network ROI. C, Representation of room, task, step, and item information in individual ROIs in the MD network (red) and DMN (yellow). Asterisks indicate significance of 1-tailed t tests against zero, controlling FDR < 0.05 across ROIs, separately for each information type. All panels: error bars represent ±1 SEM across subjects; *p < 0.05, **p < 0.01, ***p < 0.001.
