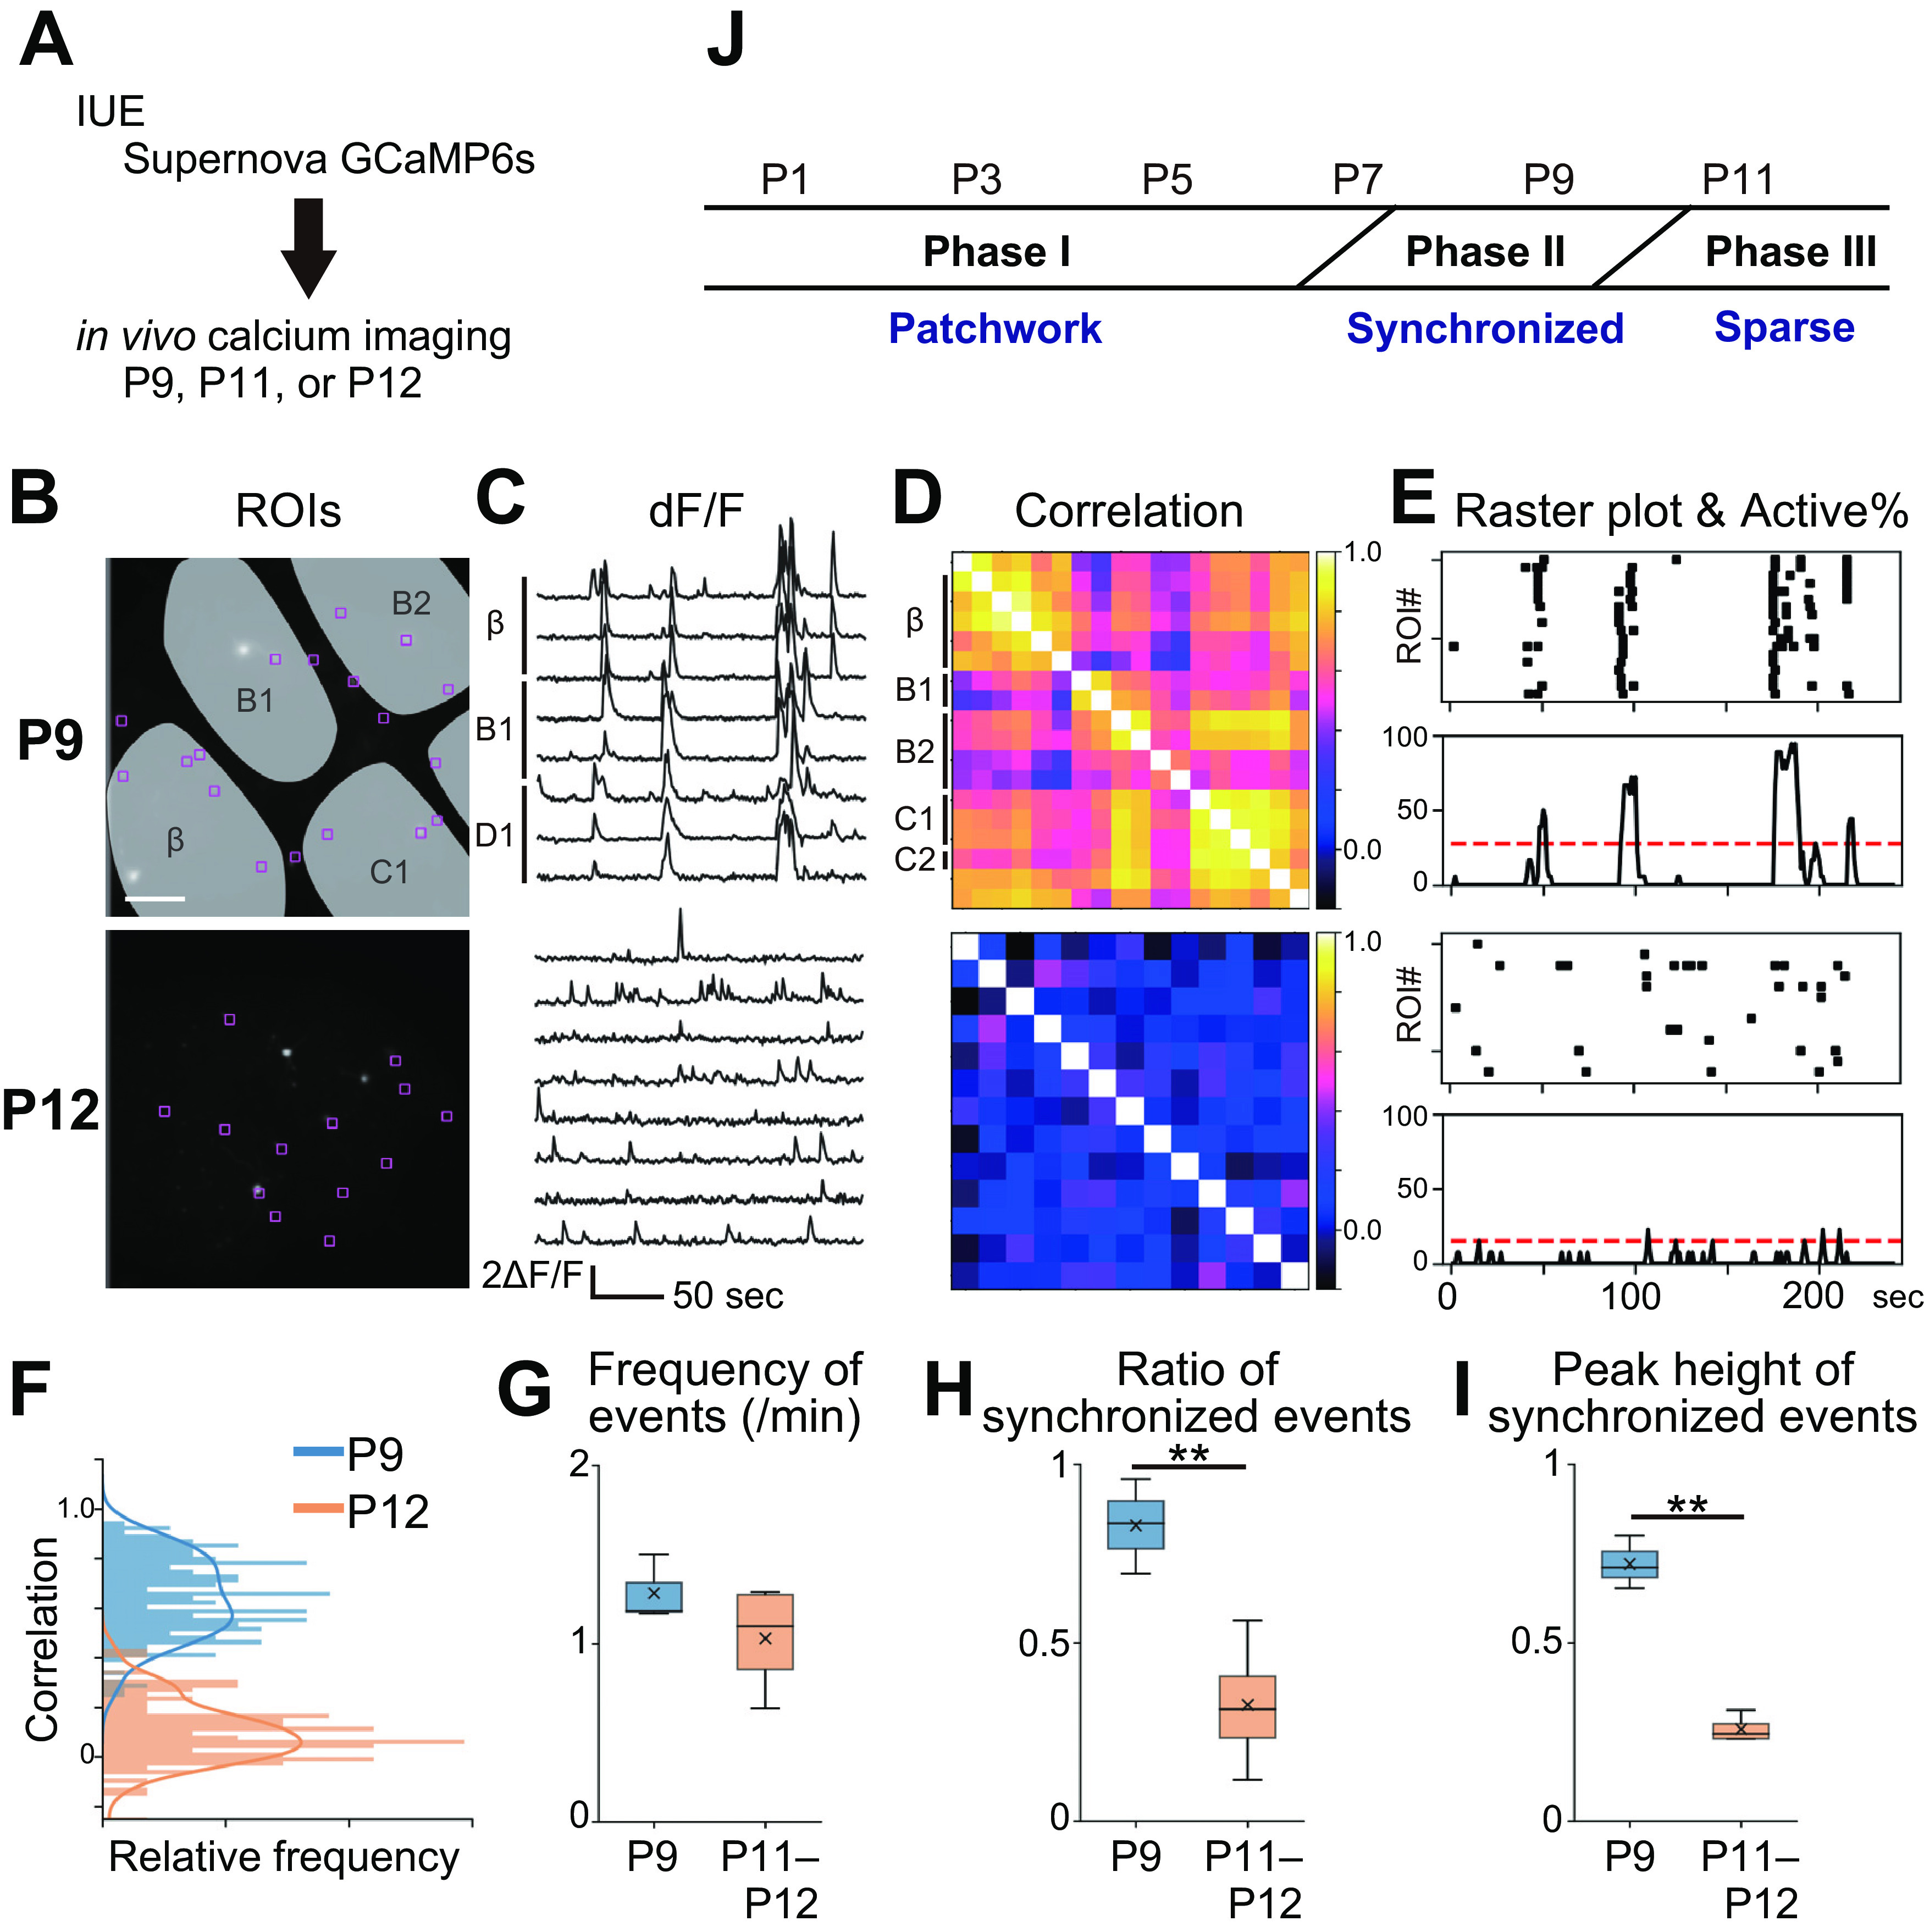
Figure 3.

Spatial organizations of L4-neuron spontaneous activity in the barrel cortex at P9 and P11–P12. A, Schematic of in vivo calcium imaging with Supernova-mediated sparse L4-neuron GCaMP6s labeling. B, ROIs were placed on individual L4 neurons. Scale bar, 100 μm. C, Representative examples of in vivo calcium transients. D, Pairwise ROI correlation matrices. E, Raster plots and active neuron ratio histograms. Dashed red lines indicate the chance rate (p = 0.01). F, Distribution of pairwise correlation coefficients shown in D. G, Frequency of neuronal firing events. ROI averages of individual mice at P9 and P11–P12 were compared. H, The peak height of synchronized events: the ratio of synchronized events to total firing events. ROI averages for individual mice were compared between P9 and P11–P12. I, The ratio of active ROIs to total ROIs in individual synchronized events. Maximum number of ROIs that fired together during individual synchronized events was divided by total ROI number, and averages for all synchronized events in individual mice were compared between P9 and P11–P12. J, Three phases of spontaneous network activity observed in barrel-cortex L4 neurons during the first two weeks of postnatal development. **p < 0.01.
