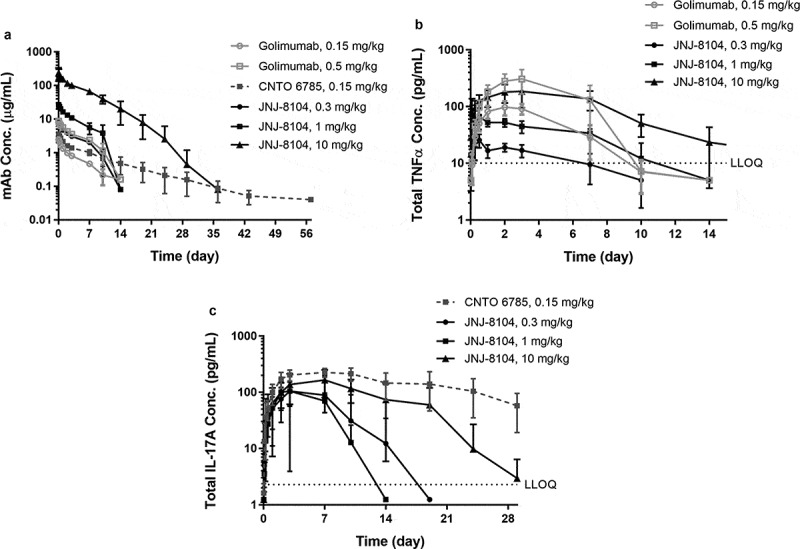
Figure 3.

Observed serum concentrations versus time profiles of Total mAb (a), total TNF (b), and Total IL-17A (c) following IV administration of golimumab (parental anti-TNF), CNTO 6785 (anti-IL-17A with identical parental Fab arms) or JNJ-8104 at the specified dose levels in cynomolgus monkeys. Data are represented as mean ± SD.
