
Figure 4.
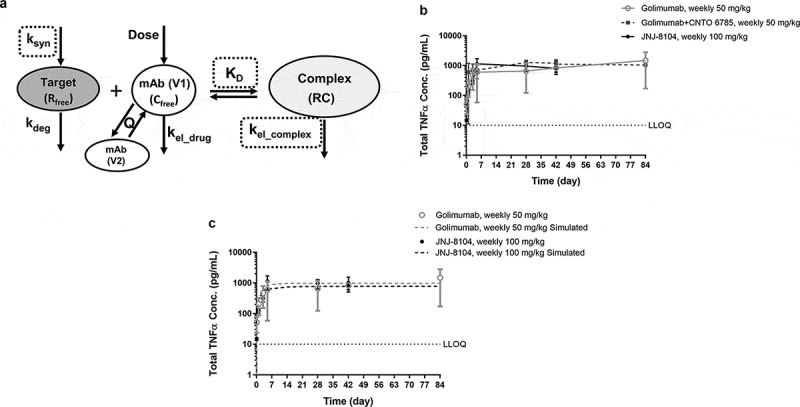
(a) Schematic representation of the TMDD-based PK/TE model. The model parameter names are as defined in Materials and Methods. (b) Observed serum concentrations versus time profiles of Total TNF following 14 weekly high doses of golimumab, golimumab + CNTO 6785 or JNJ-8104 in cynomolgus monkeys. (c) Observed (symbols) and model-predicted (dashed lines) serum concentrations versus time profiles of Total TNF following high doses of golimumab or JNJ-8104 in cynomolgus monkeys. Data are represented as mean ± SD.