
Figure 5.
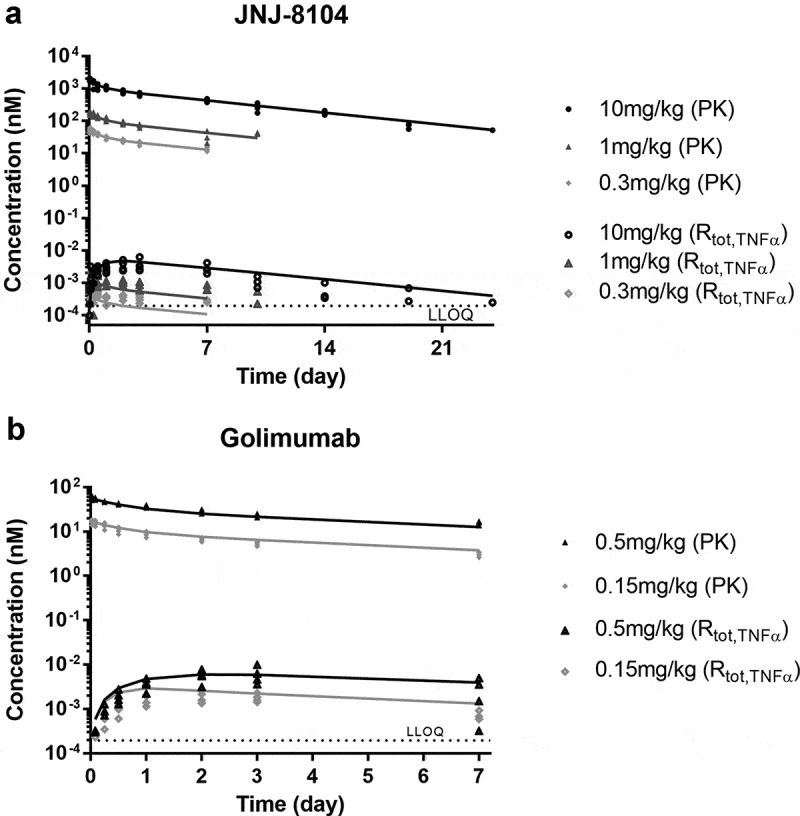
PK/TE model fitting of PK and Total TNF profiles following IV administration of JNJ-8104 (a) and golimumab (b) in cynomolgus monkeys. Symbols = Observed individual data; Lines = Mean model prediction.
Official websites use .gov
A
.gov website belongs to an official
government organization in the United States.
Secure .gov websites use HTTPS
A lock (
) or https:// means you've safely
connected to the .gov website. Share sensitive
information only on official, secure websites.
PK/TE model fitting of PK and Total TNF profiles following IV administration of JNJ-8104 (a) and golimumab (b) in cynomolgus monkeys. Symbols = Observed individual data; Lines = Mean model prediction.