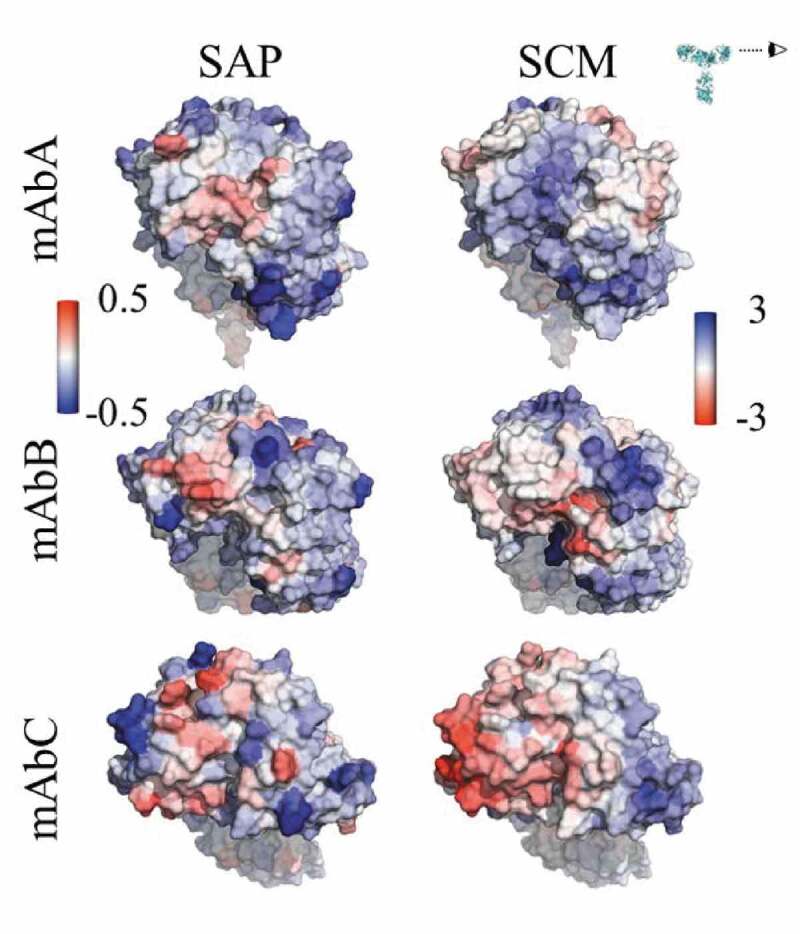
Figure 1.

Views of the Fv domains, side-on, as indicated by the eyeball in the inset, so that the figures include all complementarity-determining regions. The figures are colored by the atomic SAP and atomic SCM scores. Each antibody has some hydrophobic regions on the Fv, indicated by red coloring in the SAP figures, although mAbC has the most exposed hydrophobicity. The SCM coloring indicates mostly positive charge (blue) on mAbA, both positive and negative charges on mAbB, and mostly negative charge on mAbC.
