
Figure 7.
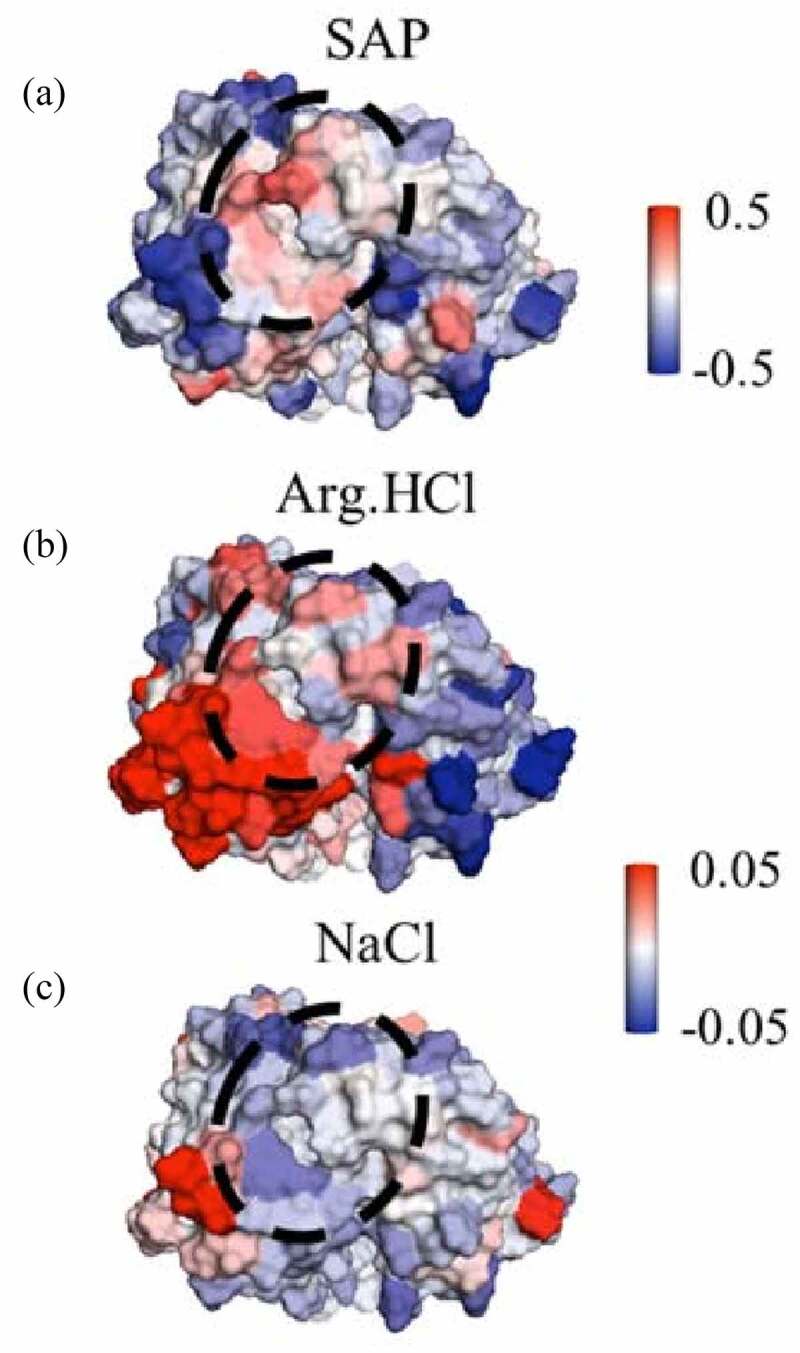
Views of a portion of the mAbC Fv. (a) is colored by the SAP score, with red indicating exposed hydrophobicity. (b) and (c) are colored by the local values with Arg.HCl and NaCl, respectively, with red indicating inclusion. Values are taken from simulations with bulk excipient concentrations of 0.15 m. Arg.HCl is net included in the circled high-SAP patch (), while NaCl is net excluded from this patch (). Views are of the Fv domain, side-on, so that the figures include all complementarity-determining regions, albeit from a slightly higher angle than in Figure 6 so as to view the whole high-SAP region, circled.