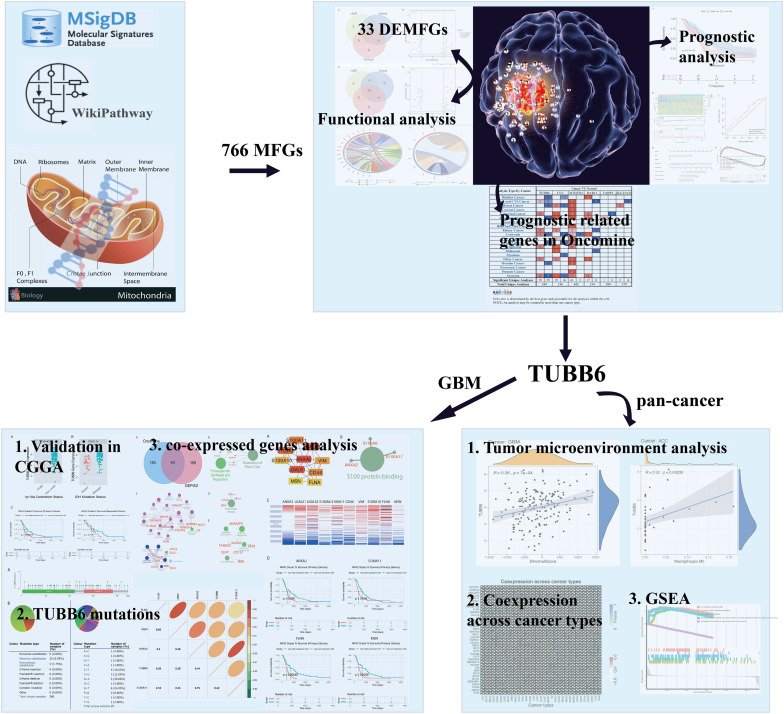
FIGURE 1.
Flow chart of strategies in this study. The illustration of mitochondrion and GBM were downloaded from website: https://pulmonaryhypertensionnews.com/wp-content/uploads/2015/01/mitochondria.jpg and https://www.medicalnewstoday.com/articles/321809.

