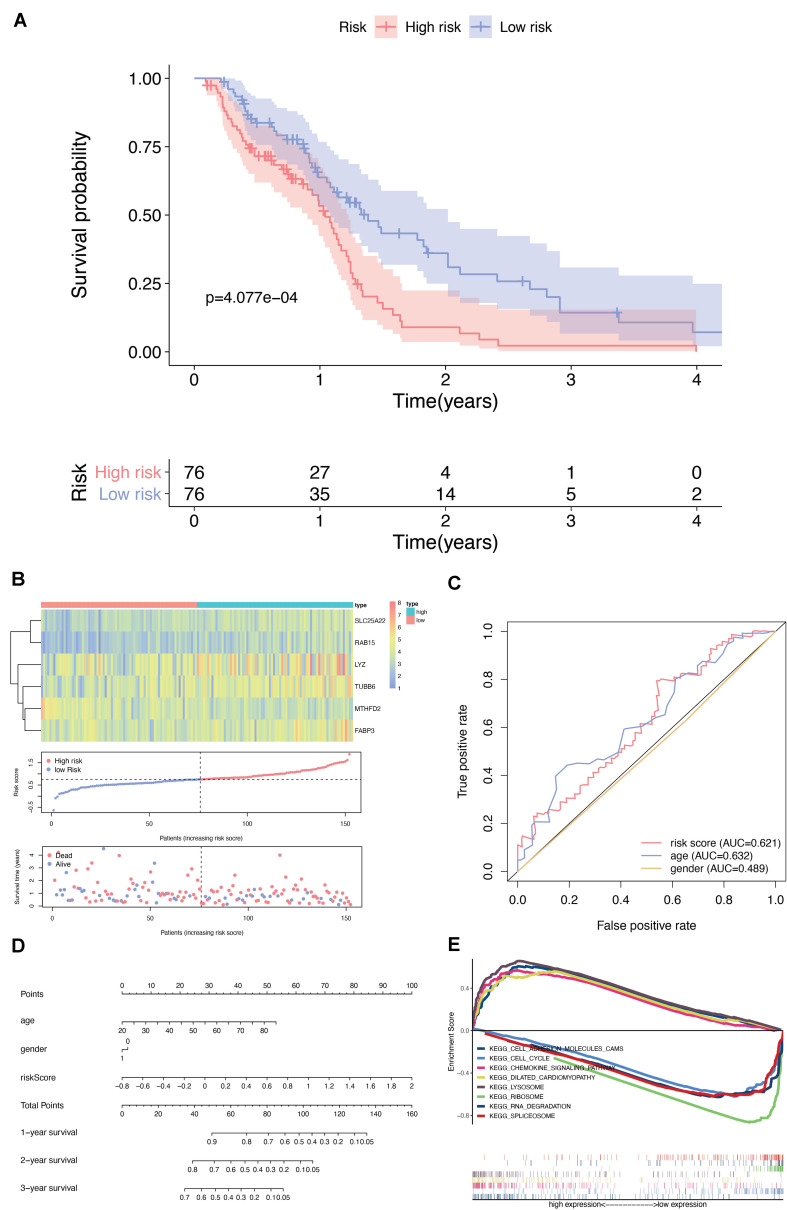
FIGURE 5.
Screening and identification of DEMFGs. (A) Kaplan-Meier survival curves of the six-gene risk signature for TCGA-GBM dataset. (B) Heatmap of the six-DEMFGs in the high-risk and low-risk subgroups for the training set. The six-DEMFGs-based risk score distribution, patient survival status. (C) ROC risk six-gene risk signature distinguished the clinicopathological features of GBM. (D) Prognostic nomograms predicting the probability of 1-, 3-, and 5-years. (E) GSEA of KEGG pathways (MsigDB) significantly regulated in DEMFGs, q-value < 0.05 was chosen as cutoff for exploratory data analysis.

