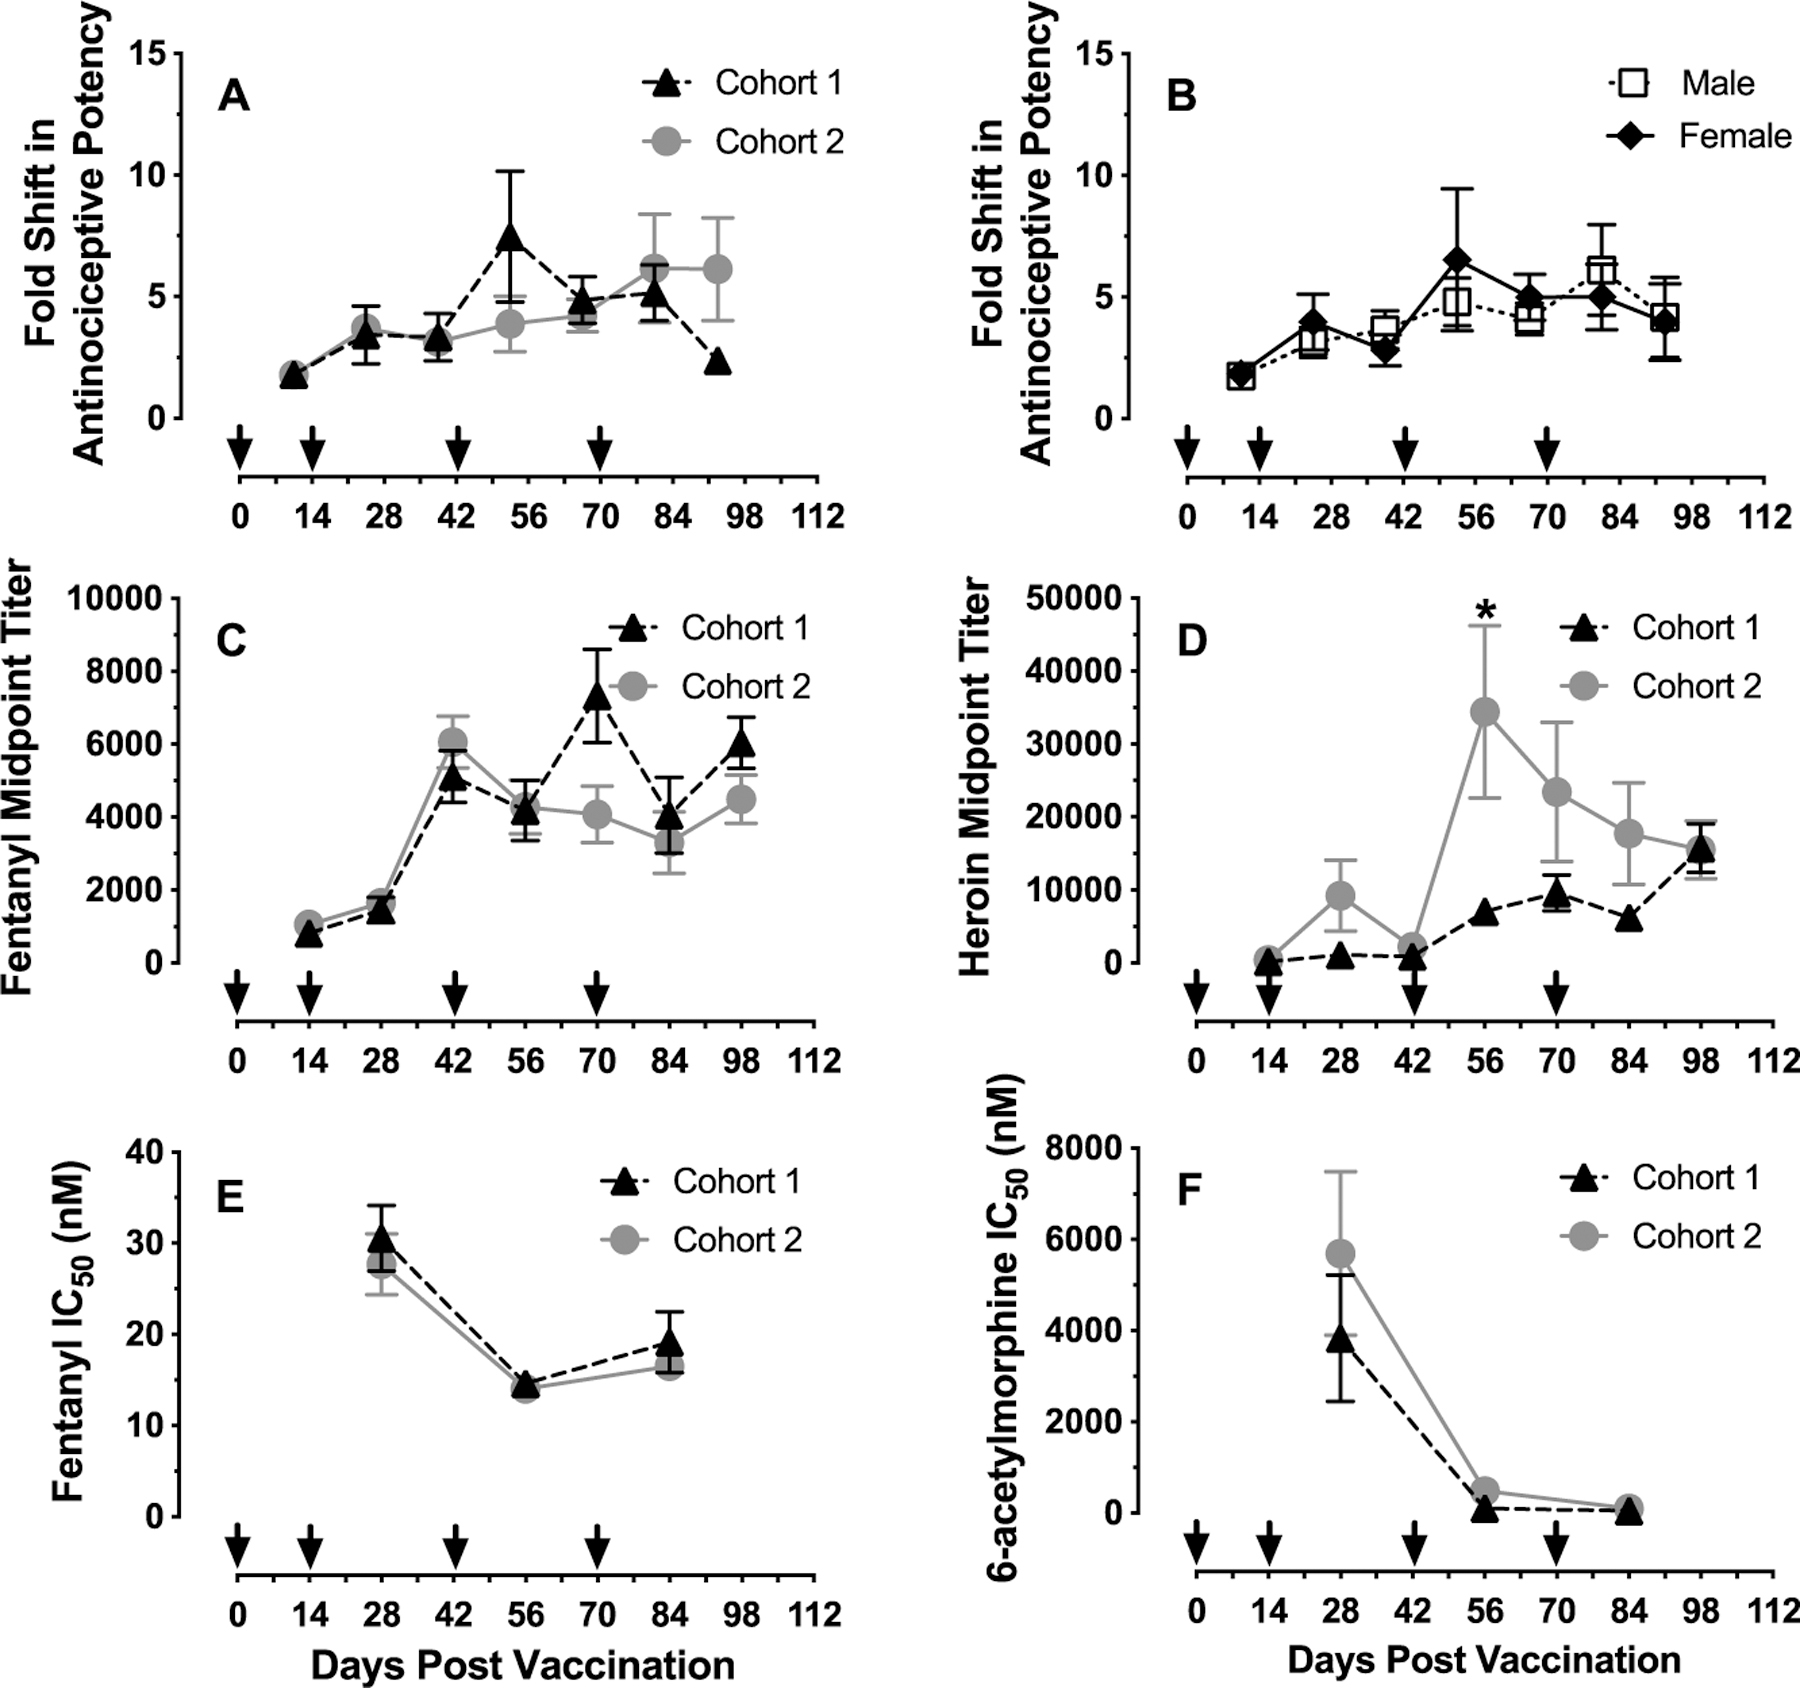
Figure 4.

Time course of vaccine effectiveness, antibody midpoint titer levels, and affinities. Abscissae: experimental timeline with arrows indicating vaccination dates. Top ordinates: fold shift in antinociceptive potency of the 1:27 fentanyl/heroin mixture relative to prevaccination ED50 values. Middle ordinates: midpoint titer levels. Bottom ordinates: antibody IC50 values in nM determined from antiserum. Panel A shows vaccine effects on antinociceptive potency as a function of experimental day in Cohort 1 (n = 3 male, 3 female rats) and Cohort 2 (n = 3 male, 3 female rats). Panel B shows vaccine effects on antinociceptive potency as a function of experimental day in 12 rats (6 female and 6 male) from both Cohorts 1 and 2. Panels C and D show antifentanyl (left) and antiheroin (right) midpoint titers as a function of experimental day in Cohort 1 and Cohort 2. Panels E and F show antifentanyl (left) and anti-6-acetylmorphine (active heroin metabolite; right) antibody affinity (IC50 value) as a function of experimental day in Cohort 1 and Cohort 2. All points represent mean ± SEM. One male of Cohort 2 lost catheter patency before the Day 98 evaluation and was excluded from that time point. The asterisk in Panel D indicates significant difference in heroin midpoint titer levels between Cohorts 1 and 2 on Day 56, defined as p < 0.05.
