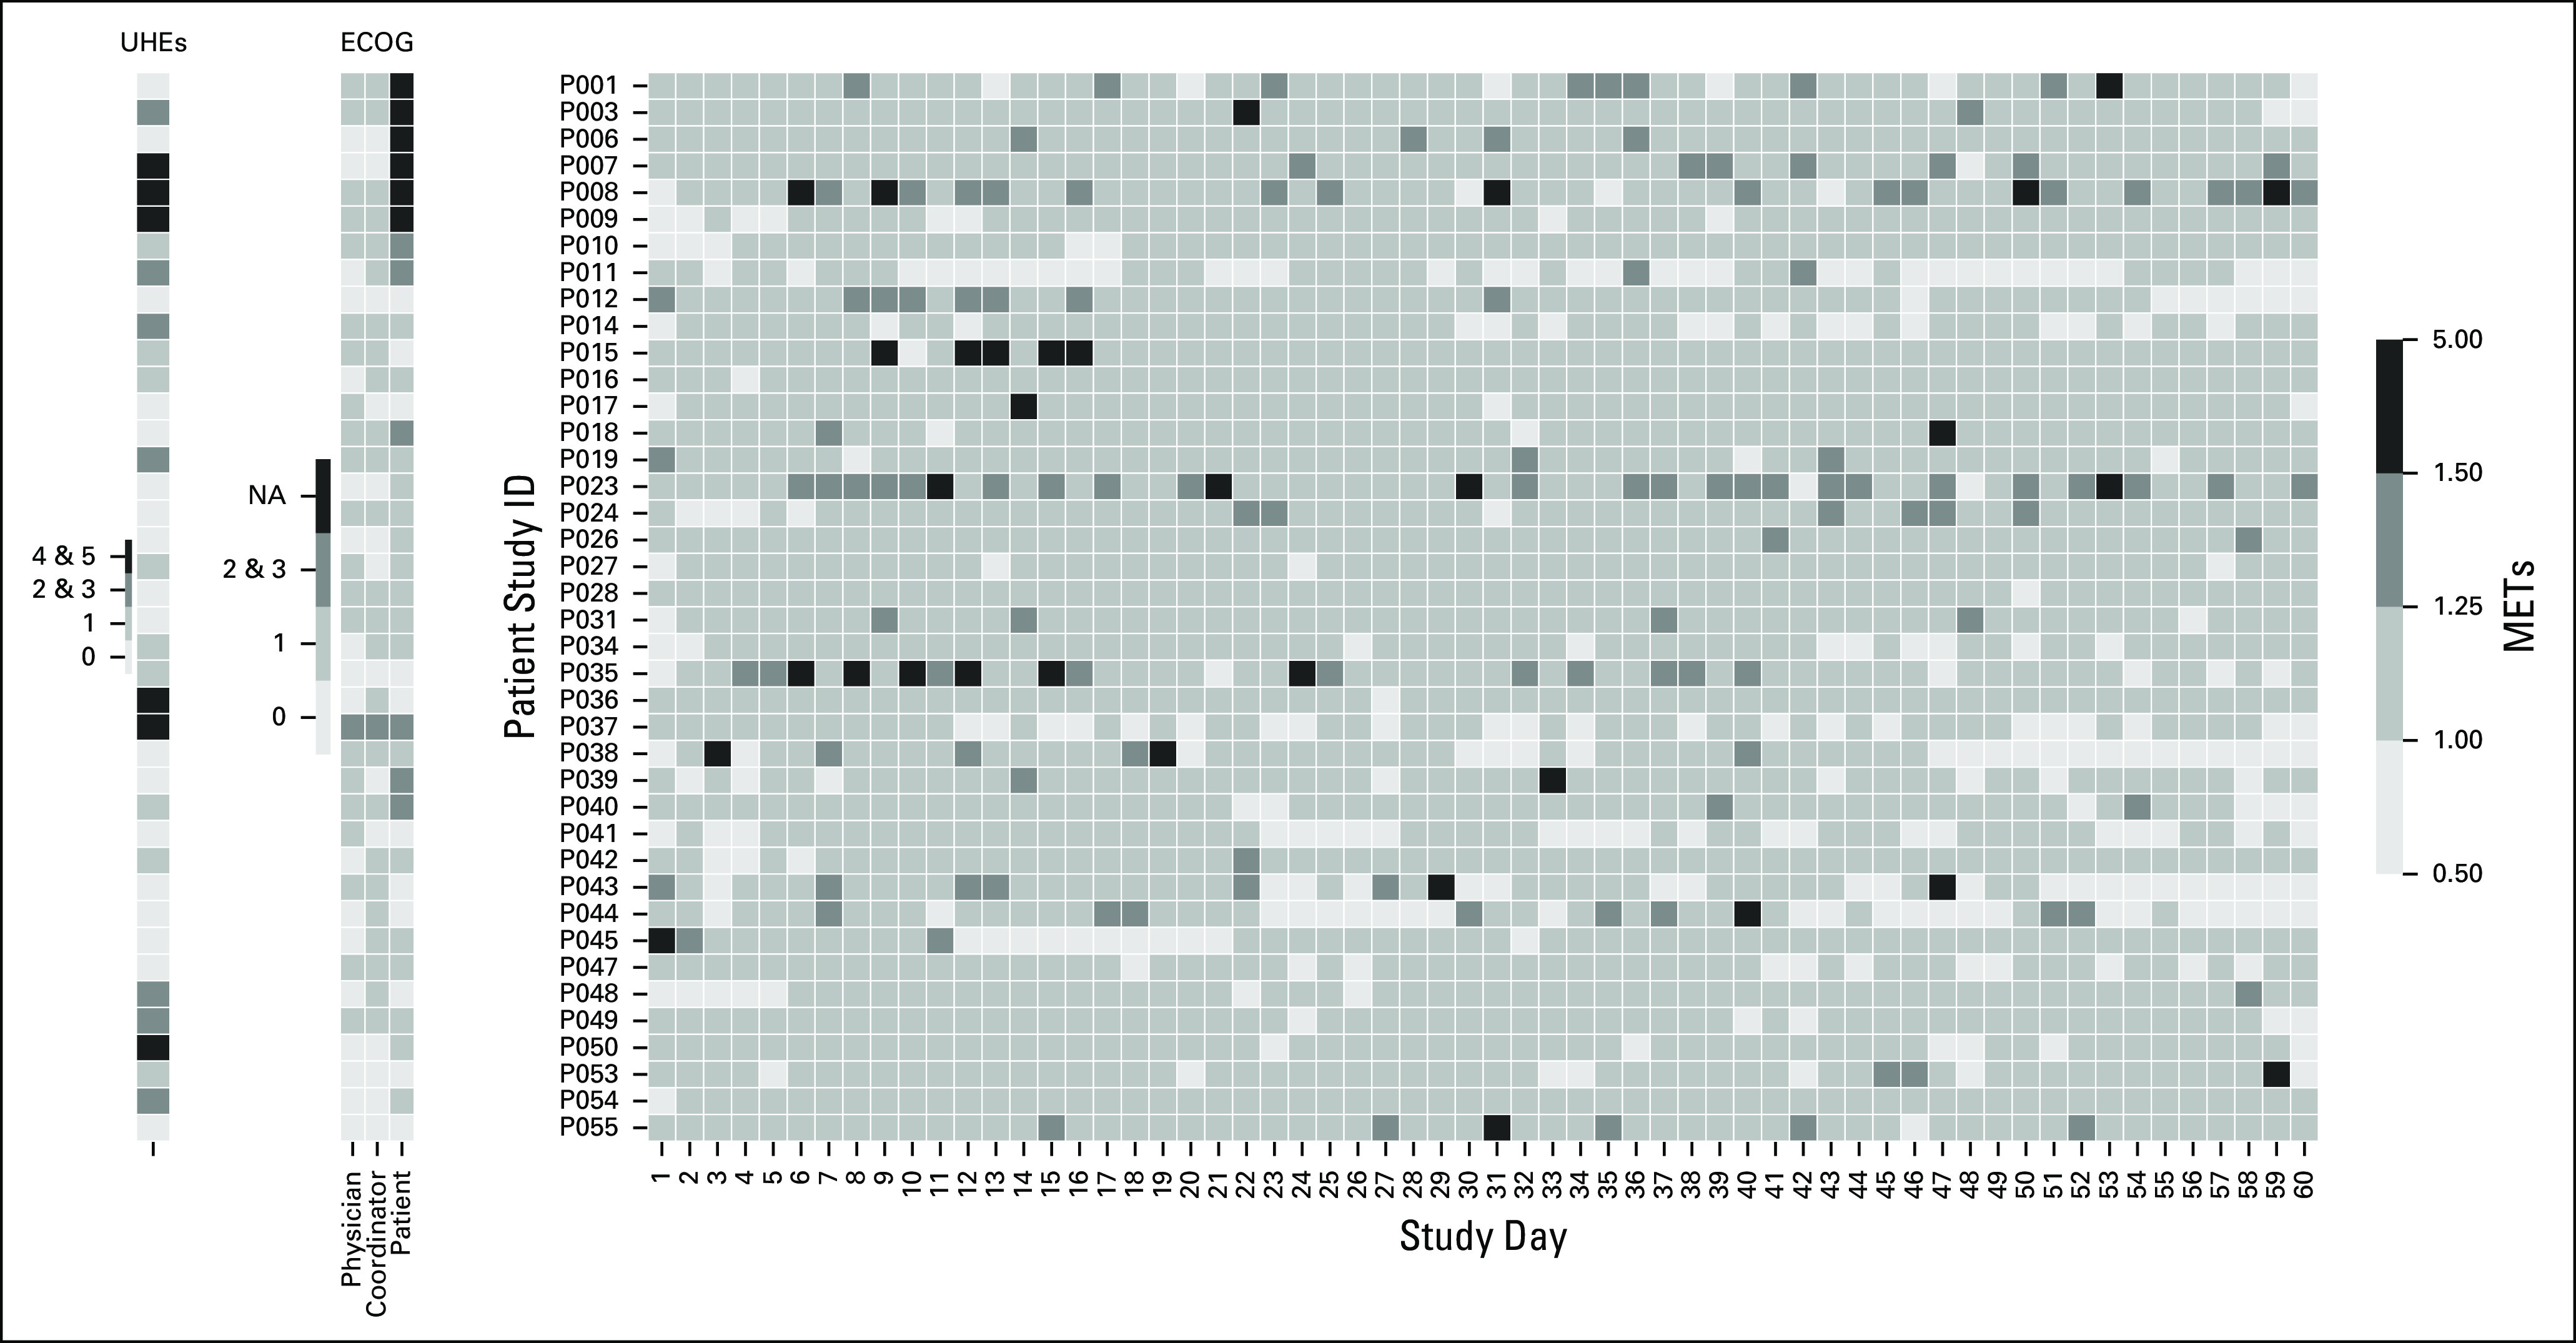
FIG A3.

Heat map of average hourly metabolic equivalents of task (METs) for each study day. Each row represents an individual patient. On the left side, Eastern Cooperative Oncology Group (ECOG) scores and unplanned health care encounters (UHEs) are provided for reference. NA, not available.
