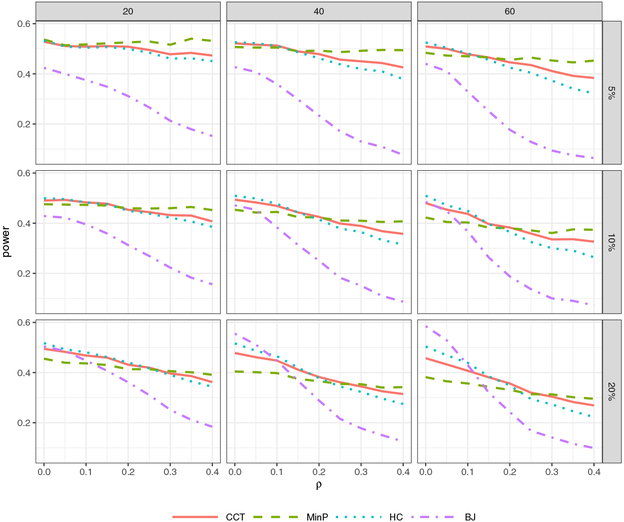
Figure 3:
Power comparison of CCT, MinP, HC and BJ. The x-axis is the correlation strength ρ. The columns from left to right correspond to the dimension d = 20, 40, 60. The rows from top to bottom correspond to the signal percentage 5%, 10% and 20%. The signal strength is chosen to make the power in every setting comparable.

