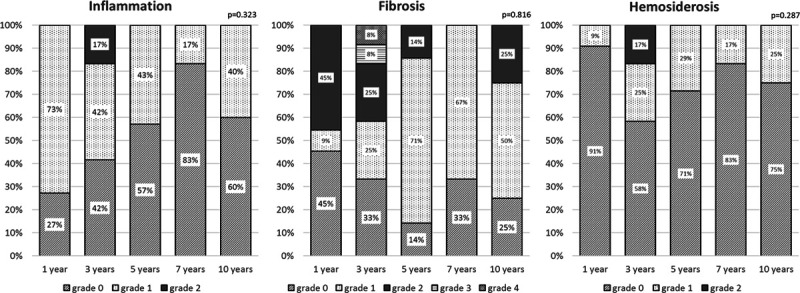
FIGURE 2.

Bar graphs show laboratory results of inflammation, fibrosis, and hemosiderosis of the graft according to the routine biopsies at the check examination after 1, 3, 5, 7, and 10 y after liver transplantation. There were no significant difference over the y (N = 29).
