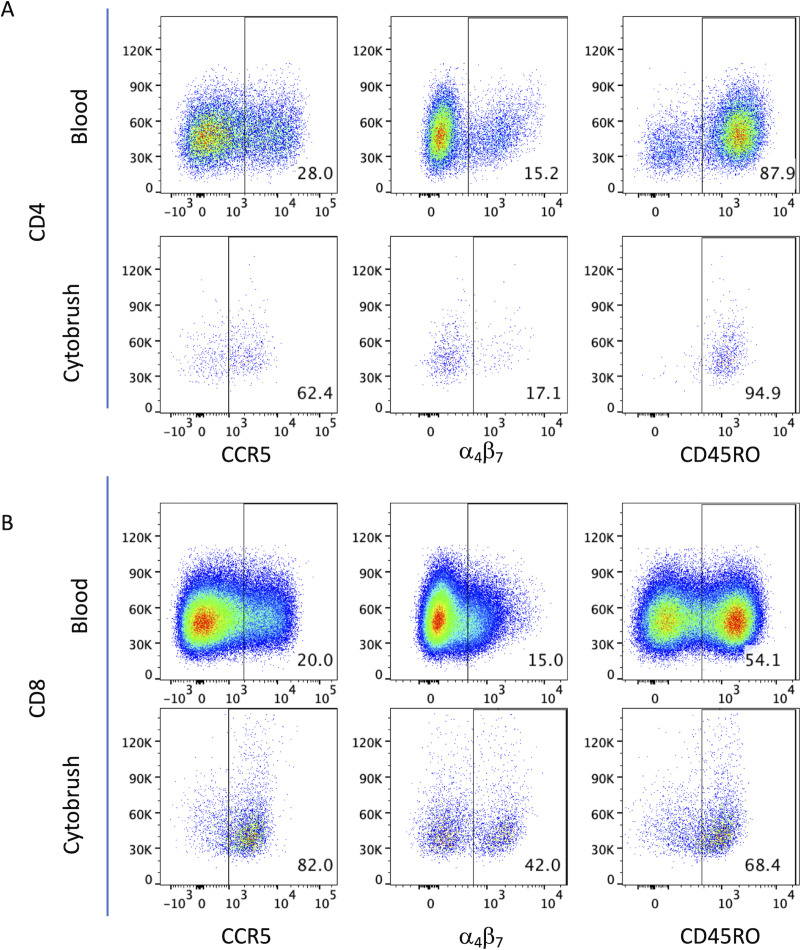
Fig 1. Phenotypic characterization of T cells from cervical mucosa and peripheral blood.
Representative pseudocolour dot plots of peripheral whole blood and cervical cells showing the expression of CCR5 (left panels), α4β7 (middle panels) and CD45RO (right panels) on CD4 and CD8 T cells (A and B, respectively). Samples were first gated on CD3+CD45+ T cells and then analysed for the expression of phenotypic markers of interest on CD4+ and CD8+ T cells. FMO controls were used to set gates for each sample type (peripheral blood or cytobrush) separately.

