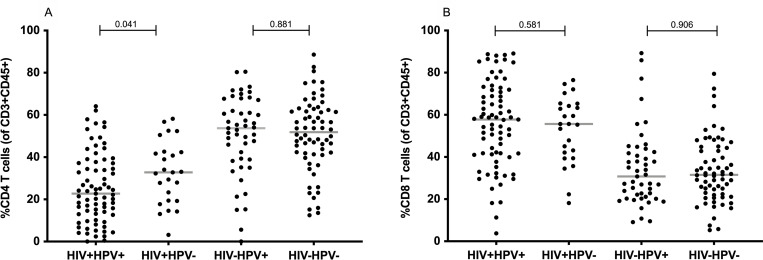
Fig 2. Cervical CD4 and CD8 T-cell frequencies stratified by HIV and HPV infection status (n = 213; HIV+ HPV+ = 75, HIV+ HPV- = 25, HIV- HPV+ = 47, HIV- HPV- = 66).
Frequency of cervical CD4 (A) and CD8 (B) T cells is shown as percent of CD3+CD45+ lymphocytes. Each dot represents one patient. HPV and HIV infections status are indicated on the x-axis. P-values were calculated using the Mann-Whitney U-test. For this graph and the subsequent graphs, the median is indicated by a horizontal line within the data points while the p-values are indicated on top of the data points.

