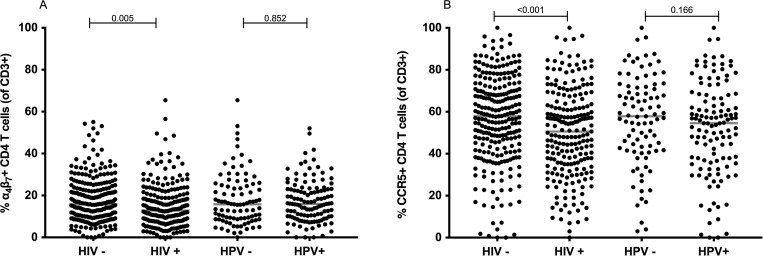
Fig 3. α4β7 and CCR5 frequencies on cervical CD4 T cells stratified by HIV and HPV infection status (HIV- = 215, HIV+ = 253, HPV— = 91, HPV+ = 122).
The frequency of α4β7+CD4 (A) and CCR5+CD4 (B) T cells is shown as a proportion of CD3 T cells for each sample. HIV and HPV infections status is indicated on the x-axis. Median frequencies are indicated. Statistical analysis was performed using the Mann-Whitney U-test.

