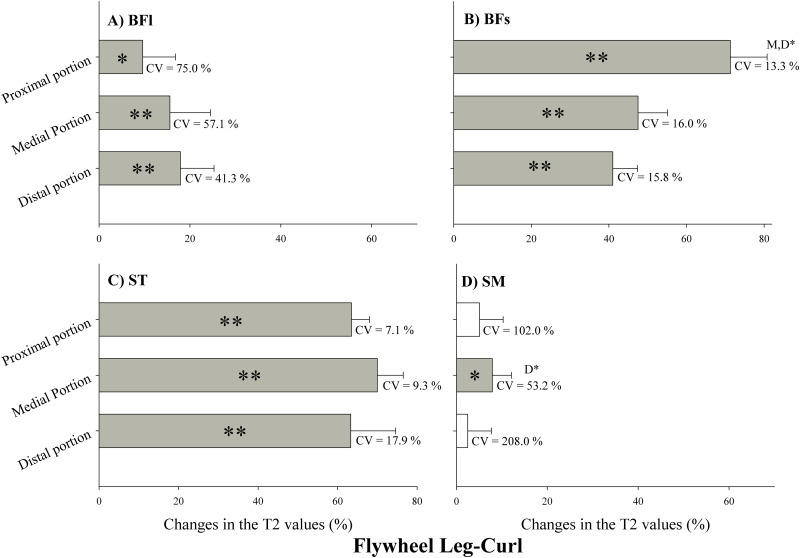
Fig 5. Changes in the transverse relaxation time (T2) values immediately after flywheel leg-curl exercise.
Values are given as a percentage of the pre-values. BFl: biceps femoris long head; BFs: Biceps femoris short head; ST: semitendinosus; SM: semimembranosus. CV: coefficient of variation. P: proximal portion; M: medial portion; D: distal portion. ** Significant difference between muscle regions (p<0.01). * Significant difference between muscle regions (p<0.05). Open bars represent no statistical changes.

