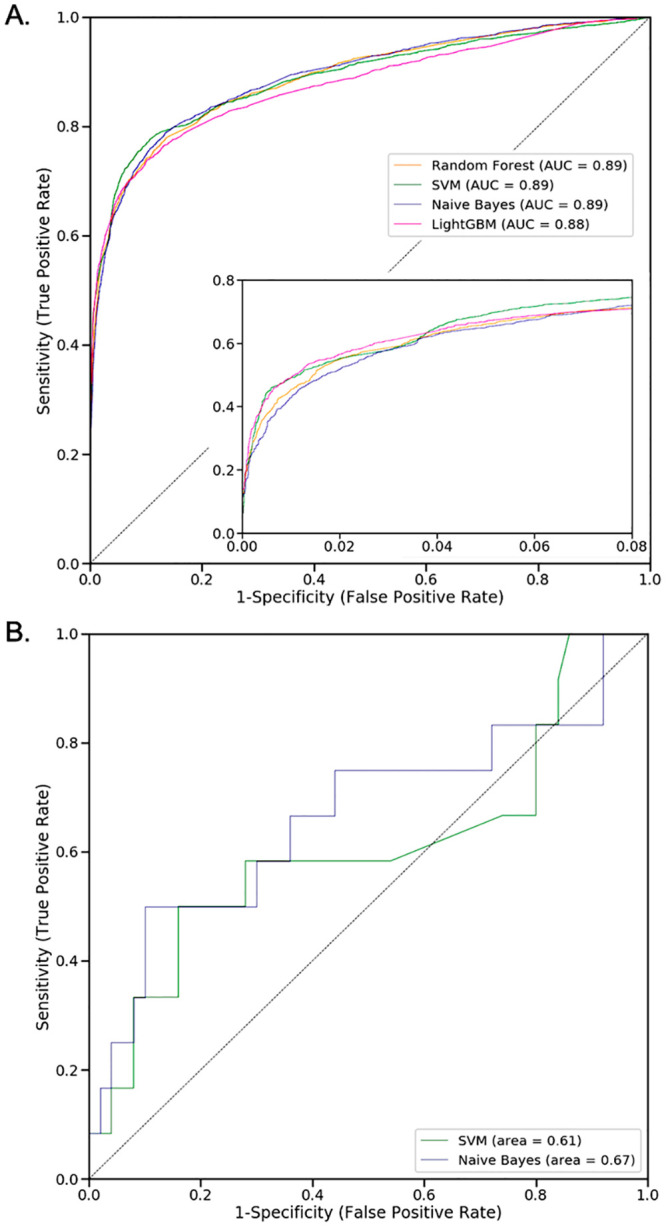
Fig 3. The performance of the classification models according to the ROC curves.

[A.] presents the independent test-set performance for ALC patients and their matched controls; the insert shows a zoom of the low-false-positive part of the curves. [B.] presents the ROC curves of the SVM and NB models trained on the set of ALC patients, and tested on the ALF patients and their matched controls. The RF and LightGBM models were found to not be applicable to ALF patients (see main text). In both panels, the dashed line shows the random performance of a model with no discriminatory power.
