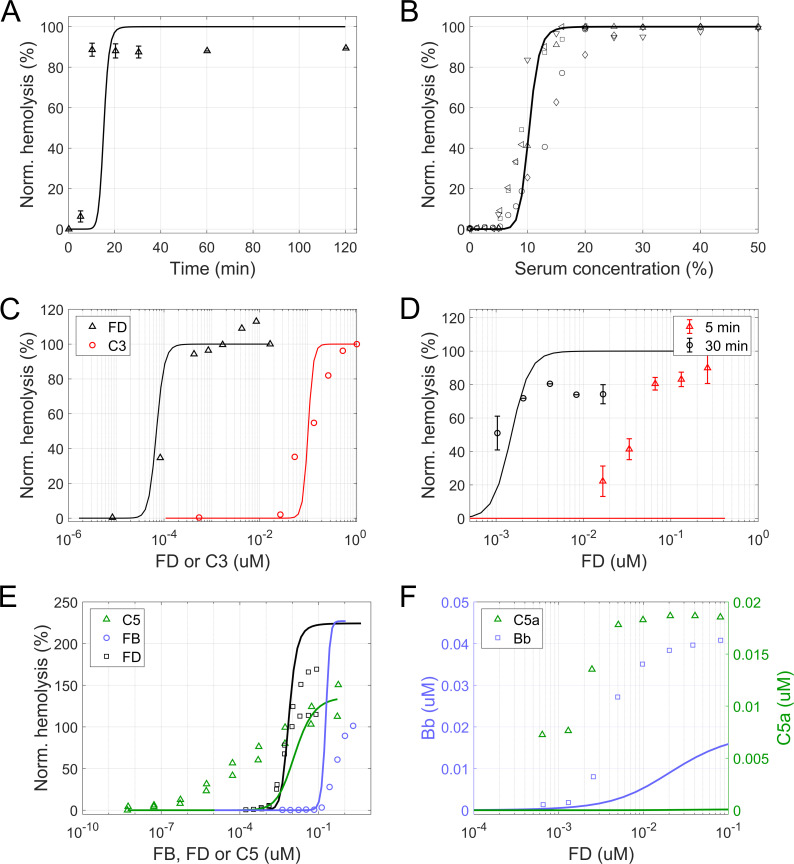
Fig 4. In vitro hemolytic experiments with rabbit erythrocytes.
Experimental data (symbols) and model simulations (lines module 1–3) in hemolytic assays with rabbit erythrocytes. (A) Time course of hemolysis at 400 ng/mL FD. (B-E) Dose-response curves for hemolysis of rabbit erythrocytes. (B,C) Hemolysis at different serum dilutions (B) or when using a mix of normal human serum and FD- (black) or C3-depleted (red) serum (C). (D) Hemolysis as a function of FD serum concentration at 5 (red) and 30 minutes (black). (E) Hemolysis at different concentrations of C5 (green), FB (blue) and FD (black). For titration of C5 and FD, data from two individual experiments are shown. (F) Dose-response curve for activation markers Bb and C5a as a function of FD concentration. Hemolysis was normalized to lysis in water (A-D) or to the activity of NHS assayed in parallel at the same dilution (E). The experimental data was obtained from [56] (A,C,D), [55] (B), and [60] (E,F).

