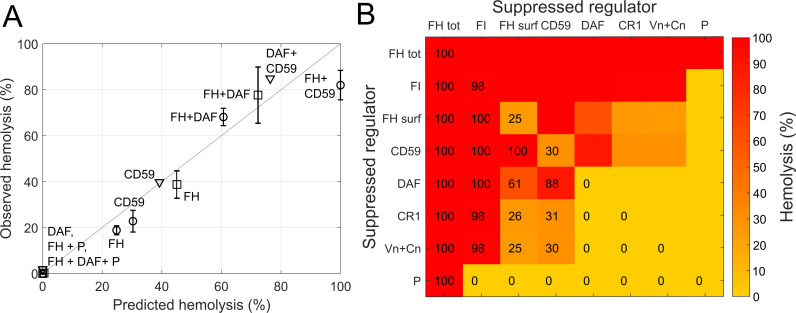
Fig 5. Hemolysis of human erythrocytes under partially disabled surface regulation.
(A) Observed versus predicted (module 1–3) hemolysis of human erythrocytes. Observations are from [59] (triangles), [57] (circles) and [58] (squares). Inhibited regulators are indicated. Suppression of FH regulation was assumed to be restricted to the surface. (B) Model predicted (module 1–3) hemolysis for pairwise suppressed regulators. Suppressed regulators are indicated on the axes (FH surf: abolished FH surface regulation, FH tot: complete absence of FH regulation). Predicted hemolysis is shown as heat map and with percent values.

