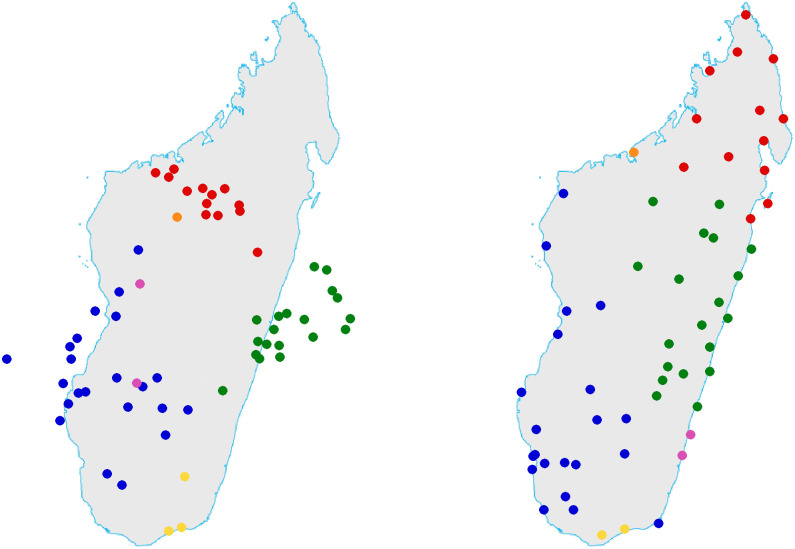
Fig 6. At the left the chart of Madagascar reconstructed by lexical input only, at the right the “true” chart.
There are three yellow spots in the left chart but only two in the right one because Antandroy (yellow) and Vezo (blue) are superposed in Toliara. To describe the result in this figure by a colorful picture, we could say that the chart at the left is the idea one could have of Malagasy geography after a discussion about European Rugby or American movies with people from different regions of the Island.

