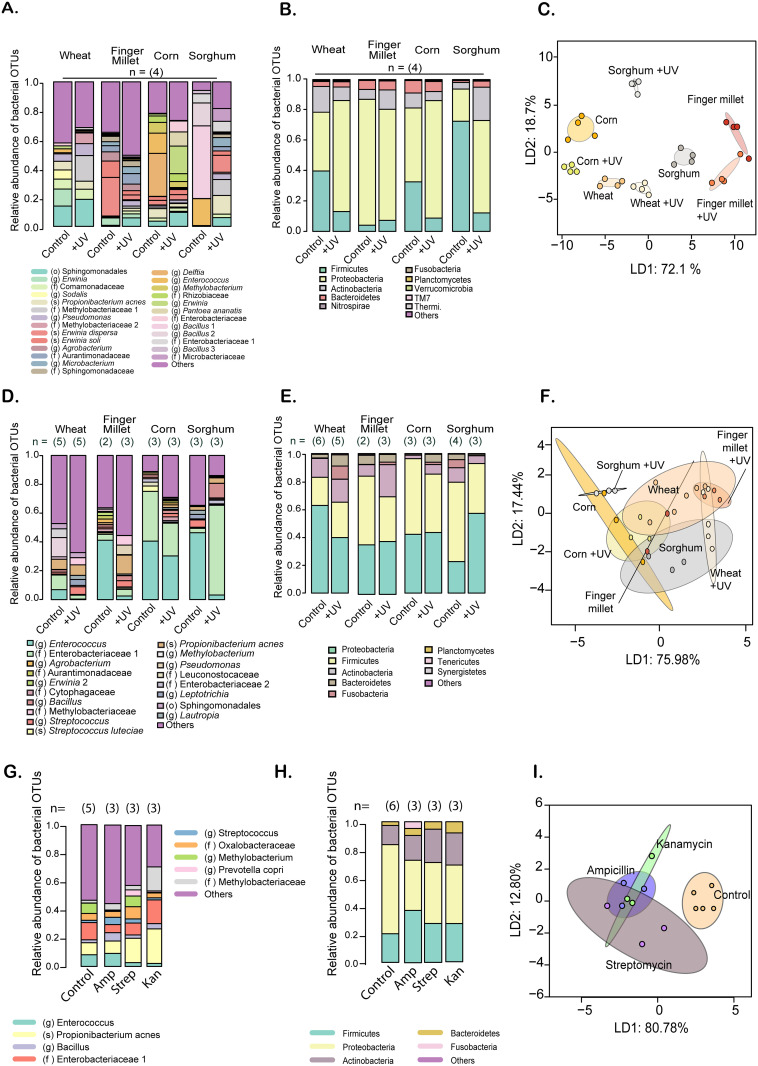
Fig 2. Flour and beetle microbiomes vary with flour type and bactericidal treatment.
(A, B, D, E, G, H) Stacked bar plots show the average relative abundance of the 5 most abundant bacterial OTUs in flour or beetle samples, across replicates in each group (sample size is noted above bars). OTUs were classified to (A, D, G) the lowest possible taxonomic level (see color key; o = order, f = family, g = genus, s = species) or (B, E, H) phylum level. (C, F, I) Principal Coordinate Analysis (PCoA) of the complete bacterial community of samples in panels A, D and G. Axis labels indicate % variation explained. Panels A–C show data for flour samples; panels D–F show data for beetle samples (isolated females reared in each flour); panels G–I show data for beetles reared in antibiotic treated wheat flour. In the colour keys, numbers after each name distinguish OTUs with the same taxonomic classification (with 97% sequence identity). Control = untreated flour, +UV = UV-treated flour, Amp = flour + ampicillin; Strep = flour + streptomycin, Kan = flour + kanamycin. For statistical analysis of full bacterial communities, see Table 1.

