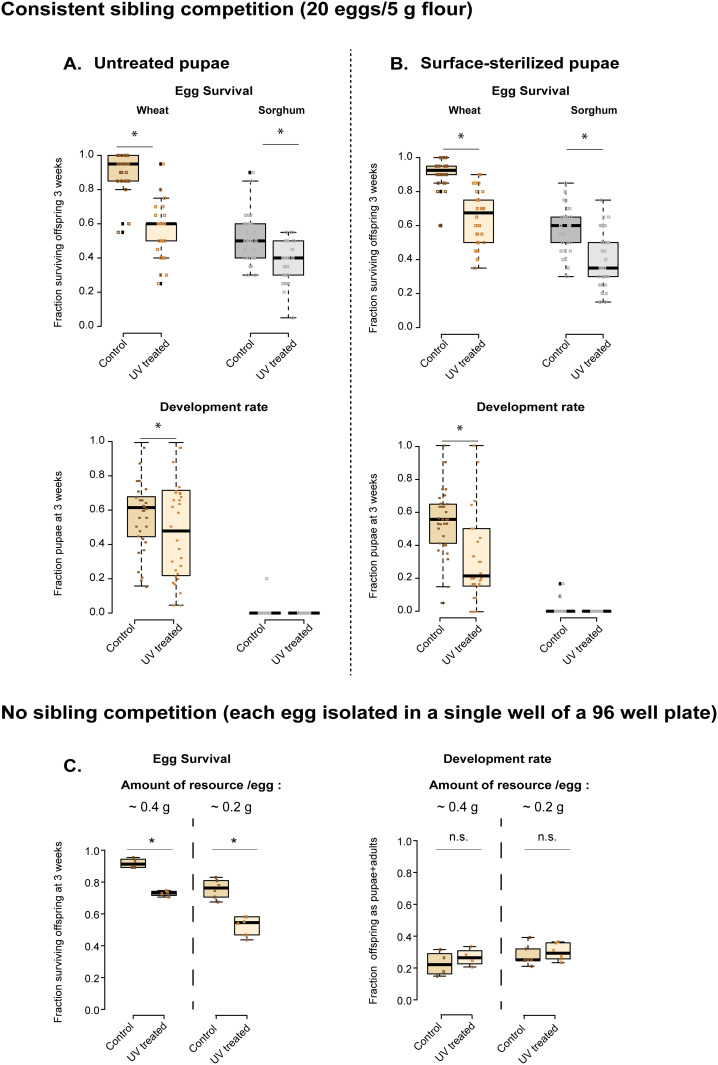
Fig 4. Effects of disrupting the flour microbiome on offspring survival and development rate, while controlling competition.
(A–B) Offspring survival and development rate in untreated (“control”) vs. UV-treated wheat and sorghum, measured for replicate groups of 20 eggs (n = 14 replicates for sorghum; n = 15 for wheat) obtained from (A) untreated and (B) surface-sterilized pupae. (C) Survival and development rate of isolated eggs provided with either 0.2 g flour (6 microplates, 576 eggs/treatment) or 0.4 g of flour (4 microplates, 384 eggs/treatment). In all panels, boxplots show median values (boxes indicate interquartile length (IQL); whiskers indicate 1.5x IQL), with overlaid raw data (each point indicates data for one replicate). Asterisks indicate a significant difference between control and UV treatment, based on pairwise comparisons using a generalized linear model.

