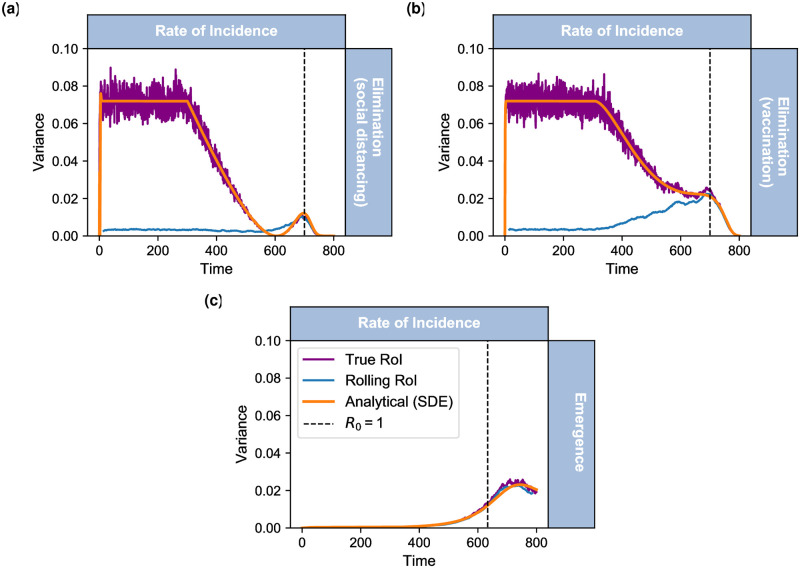
Fig 2. Variance calculated on the rate of incidence.
For each model (SIS with social distancing (panel a); SIS with vaccination (panel b); SIS emergence(panel c)) we calculate the variance on the rate of incidence, RoI between 500 homogeneous realisations at every time step (daily). Each figure shows: dynamic solution (orange line); rolling RoI calculated from new cases nc (blue line) and true RoI calculated from the production of prevalence, susceptible and effective contact rate (, purple line).

