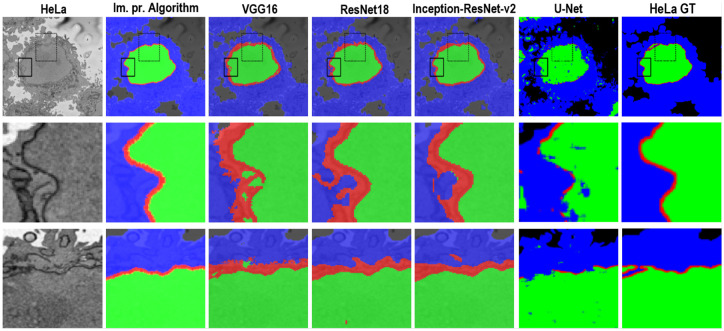
Fig 8. A representative HeLa image, semantic segmentation results overlaid on the filtered image and the ground truth.
Top row: Boxes denote two Region of Interests (ROIs) on filtered image as well as semantic segmentation results. Results were obtained from all algorithms—a traditional and four deep learning architectures. The ROIs are magnified and shown in the middle and bottom rows. Middle row: ROI 1 corresponding black box with solid line. Bottom row: ROI 2—box with dashed line. Differences in segmentation results can be seen from these ROIs—i.e. the red dot obtained from ResNet18 semantic segmentation on bottom row and 4th column.

