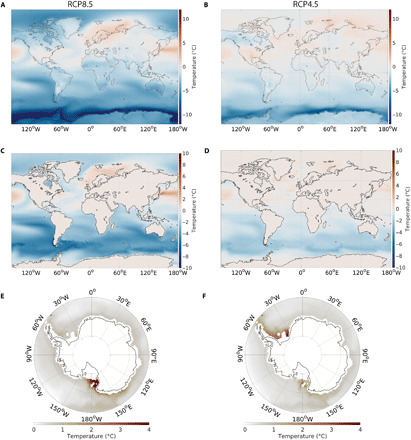
Fig. 3. Air and ocean temperatures.

(A) SAT difference (RCP8.5FW minus RCP8.5CTRL), decadally averaged for 2121–2130, shows strong cooling throughout the Southern Ocean. (B) Same as in (A), but for RCP4.5FW minus RCP4.5CTRL. Note that the cooling is limited to the Southern Hemisphere. (C) Decadally averaged sea surface temperature (SST) difference (RCP8.5FW minus RCP8.5CTRL) for 2121–2130 showing Southern Ocean cooling spreading to the equator and parts of the Northern Hemisphere. (D) Same as in (C), except for RCP4.5FW minus RCP4.5CTRL. (E) Subsurface ocean temperature difference (RCP8.5FW minus RCP8.5CTRL) at 400-m water depth, representative of continental shelf depths at the mouth of ice shelf cavities. Warming is concentrated in the Ross Sea. (F) Same as in (E), but for RCP4.5FW minus RCP4.5CTRL, showing warming concentrated in the Weddell Sea.
