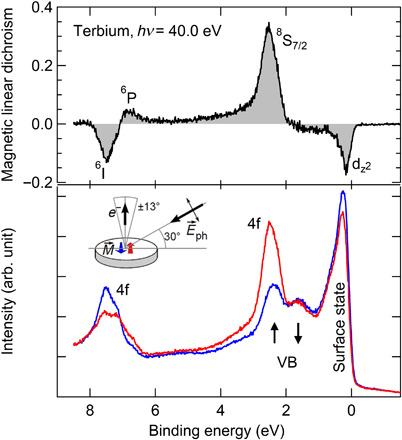
Fig. 2. Valence band photoemission spectra and MLD of Tb at 90 K.

ARPES spectra probed with p-polarized light for opposite in-plane magnetization directions (red and blue, see inset) at normal emission ϑ = 0∘. The gray backfilled difference spectrum highlights the MLD, which was evaluated for the 8S7/2 spin component. The binding energy of minority (↓) and majority (↑) spin 5d valence bands (VB) and the exchange splitting were extracted at ϑ = 8∘ (see text).
