
Fig. 2. Quadrature squeezing.
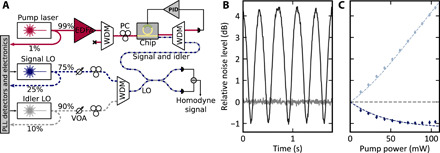
(A) Overview of experimental setup. Details in the main text and the Supplementary Materials. WDMs, wavelength division multiplexing components. LO, local oscillator; EDFA, erbium-doped fiber amplifier; PLL,phase-locked loop; VOA, variable optical attenuator; PC, polarization controller; PID, proportional-integral-derivative. (B) Quadrature variance (black line) relative to shot noise (gray line) as a function of time, while the local oscillator phase is ramped, exhibiting 1.0(1) dB of squeezing. Traces are obtained from the homodyne detector photocurrent fluctuations monitored on an electrical spectrum analyzer in zero-span mode at 20-MHz sideband frequency, with a resolution bandwidth of 1 MHz and a video bandwidth of 300 Hz. (C) Maximum and minimum quadrature variances as a function of pump power for the 20-MHz sideband, showing the power scaling of the squeezed and antisqueezed quadratures. The top and bottom dashed lines are obtained by fitting to Eq. 2; the shot noise level is shown (dashed line at 0 db)..