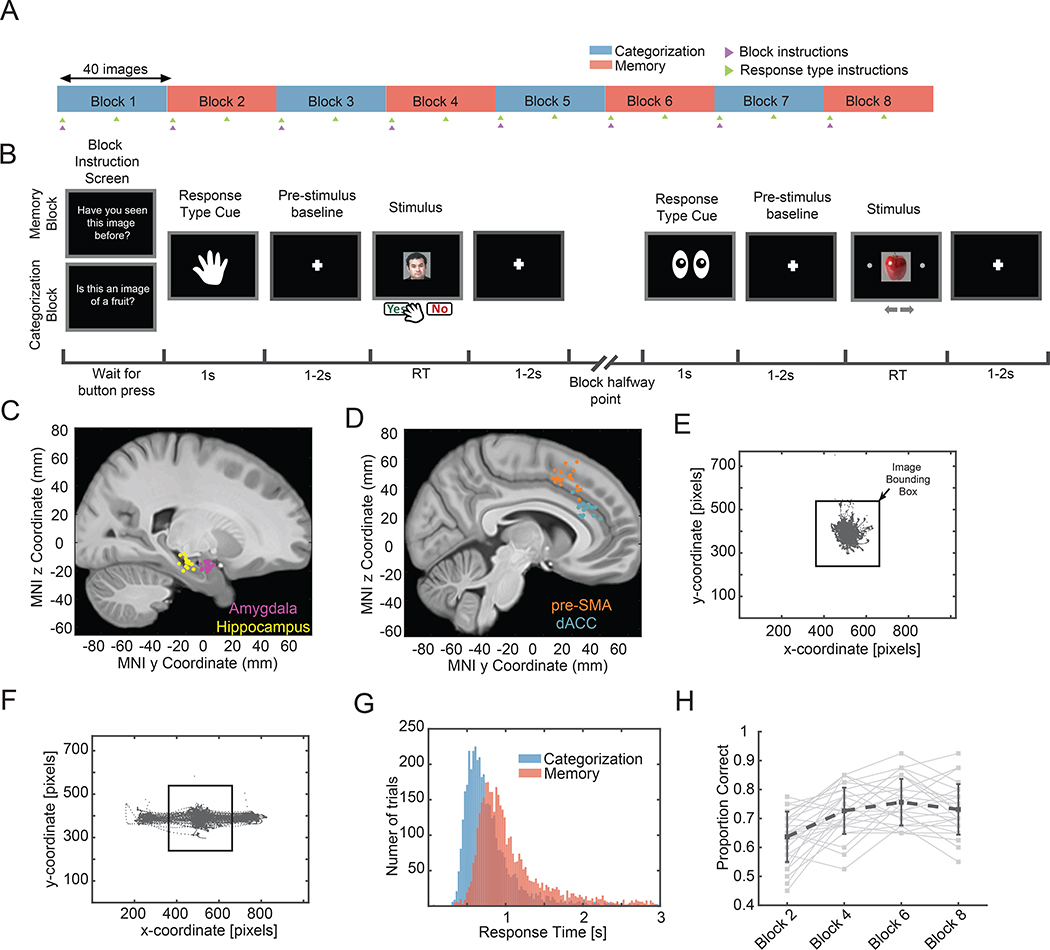
Fig. 1. Task, electrode locations, and behavior.
(A) Task structure. A session consisted of eight blocks of 40 trials. The task switched with each block (blue=categorization, red=memory), and the response modality switched halfway within each block (saccade or button press; randomly assigned at the beginning of the block). The subject was instructed about the task at the beginning of each block (magenta arrow) and how to respond at the beginning and halfway point of each block (green arrow). (B) Example of screens shown to subject for two example trials. (C-D) Electrode locations. Each dot is the location of a microwire bundle in one subject. (E-F) Eye tracking data from one session from the button press (e) and eye movement (f) trials. (G) Reaction times as a function of task across all sessions (memory, μ ± sem, 1.27±0.02s; categorization, 0.90 ± 0.02s; p =7.6e-228, 2-sample KS test). (H) Memory performance improves over the course of the experiment (β = 0.56, p=8.42e-130, logistic mixed effects model). See also Fig. S1 for an extended summary of the behavior.

