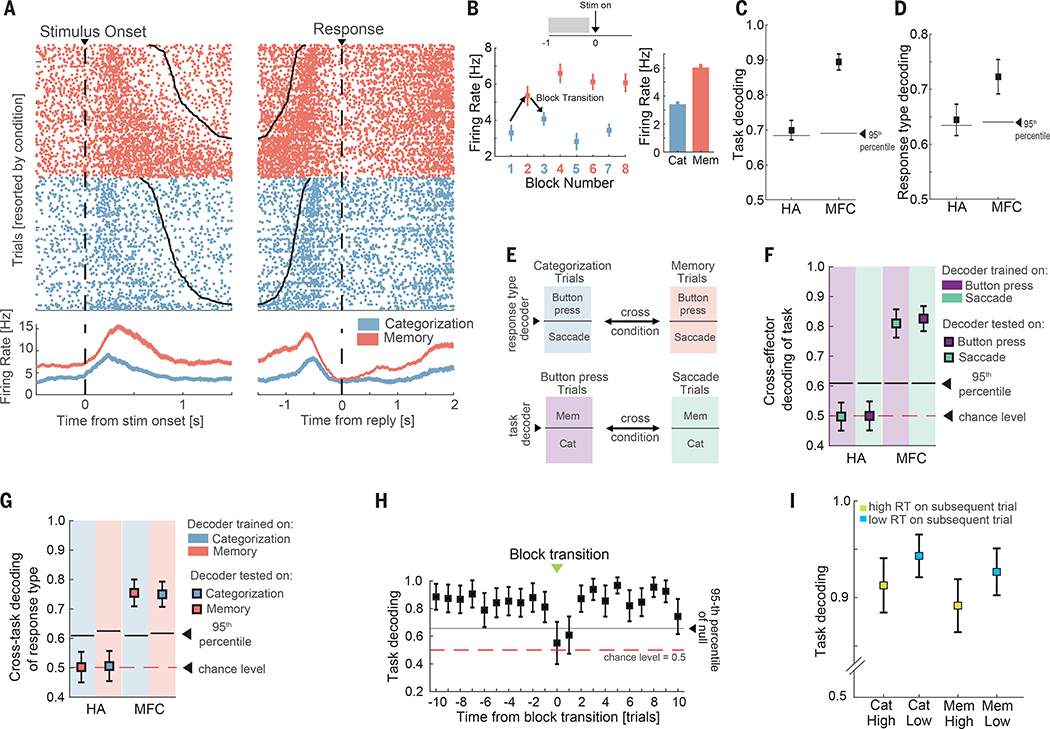
Fig. 2. Representations of task type and response modality.
(A-B) Example pre-SMA neuron. (B) Average firing rate during the baseline period (−1 to 0s relative to stimulus onset) for each block for the cell shown in (a). Shown is the average baseline firing rate across all blocks of the same type. (C-D) Population decoding of task type (c) and response modality (d). (E) Cross-condition decoding approach. The background color denotes the type of trials that were used to train a given decoder. (F) Cross-response modality decoding of task type from the baseline firing rate of all recorded cells. (G) Cross-task decoding of response modality. (H) Decoding performance as a function of trial number relative to a task type switch (green arrows in Fig. 1a; transitions from categorization to memory and vice-versa were pooled). Error bars indicate standard deviation in all panels, with the exception of panel B where they indicate the standard error of the mean. (I) Baseline decoding of task-type for subsequent trials with short reaction times was more accurate than decoding on long reaction time trials. Shown separately for categorization and memory trials (p = 2e-11 and 7e-13 respectively, Wilcoxon rank sum test). Error bars denote standard error in decoding accuracy across trials (80 trials in each of the 4 groups). See Fig. S2 for additional analyses that break down context effects by specific anatomical regions.

