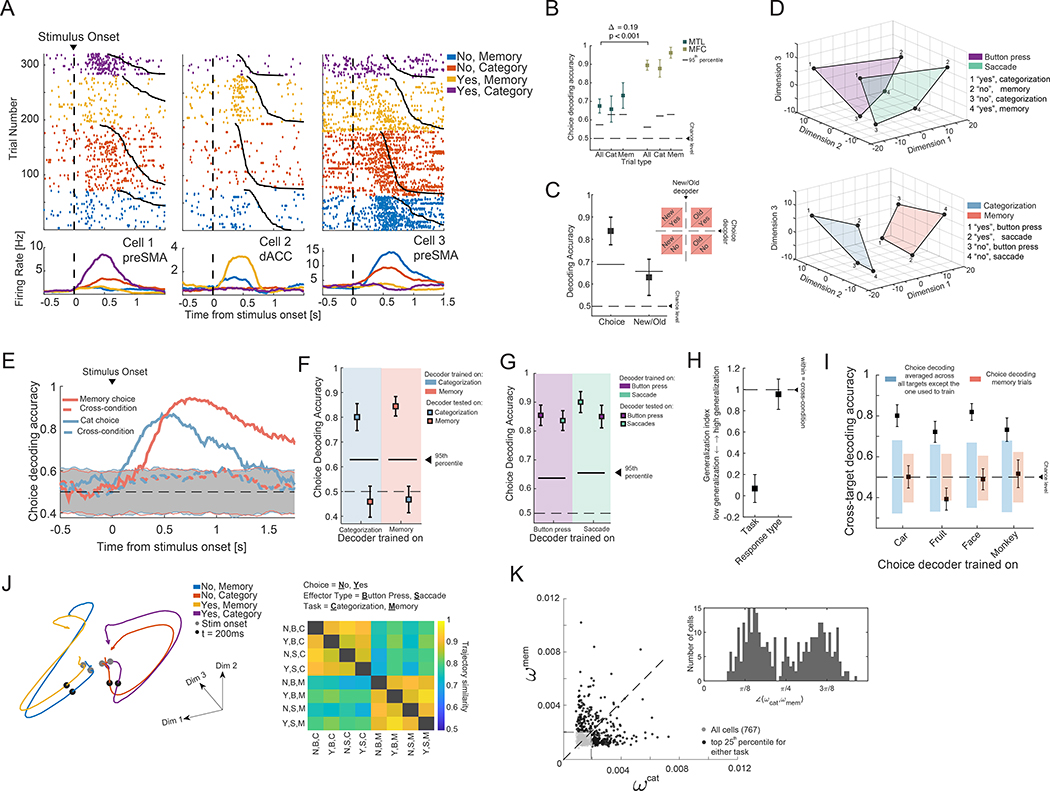
Fig. 4. Task-specific representation of choice.
(A) Example MFC choice cells, split by choice (yes or no) and task. (B) Population choice decoding accuracy was significantly greater in MFC compared to HA (across all trials, Δtrue = 19% vs. empirical null, p<1e-3). (C) MFC cells represent choice and not the ground truth (i.e. new/old; memory trials only). (D) Population summary (neural state space) of choice-related activity in MFC, plotted in 3D space derived using MDS. (Top) Variability due to response modality. The highlighted planes connect the points of state space occupied by activity when utilizing button presses (purple) or saccades (green). (Bottom) Variability due to task type. The highlighted plans connect the points of state space occupied by activity in the same task. (E) Choice-decoders trained in one task do not generalize to the other task (binsize 500ms, 16ms step size). (F) Same as (E) but for a fixed 1s time window starting at 0.2s after stimulus onset. (G) Choice decoding generalizes across effectors (also see (D)). (H) Generalization index of choice decoding (see Methods for computation) to summarize (F-G). The representation of choices generalized across response modality but not task. (I) Generalization between different sub-tasks of the categorization task but not between task types. The colored bars indicate the 5th-95th percentile of the null distribution. (J) (Left) State-space trajectories for the four conditions arising from the combination of response (yes, no) and task (categorization, memory). (Right) Trajectory similarity, computed in a 8D latent space (recovered using GPFA, see Methods) across the eight conditions arising from the combinations of choice, effector type, and task. (K) Decoder weight of each cell for decoding choice during the categorization-and memory task. The cells in the top 25-th percentile are shown in black. The inset shows the angle created by the vector [] with respect to the x-axis of the cells marked in black.

