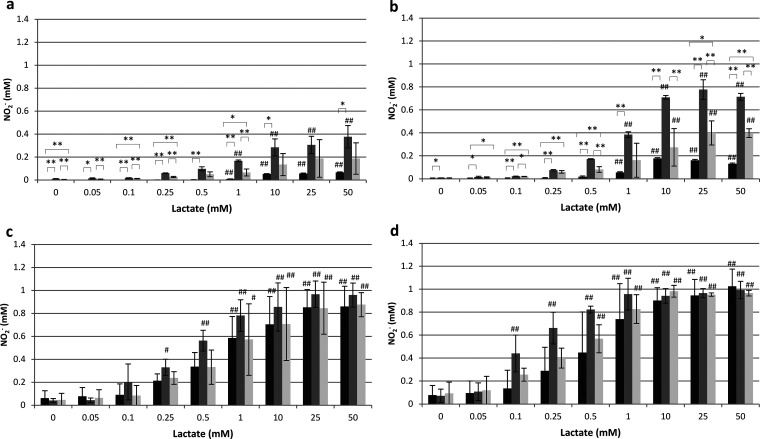
FIG 2.
NO2– production of Veillonella atypica under aerobic conditions at pH 7 (a) and pH 5 (b) and under anaerobic conditions at pH 7 (c) and pH 5 (d). Data are shown as means ± standard deviations. Asterisks indicate significant differences (*, P < 0.05; **, P < 0.01) in NO2– production among bacterial cells grown in TYL, KNO3-containing TYL, and KNO2-containing TYL (by Tukey’s test). Hashtags indicate significant differences (#, P < 0.05; ##, P < 0.01) in NO2– production from that with 0 mM lactate under the same growth conditions (by Dunnett’s test). Black bars, no addition; dark gray bars, KNO3; light gray bars, KNO2.

