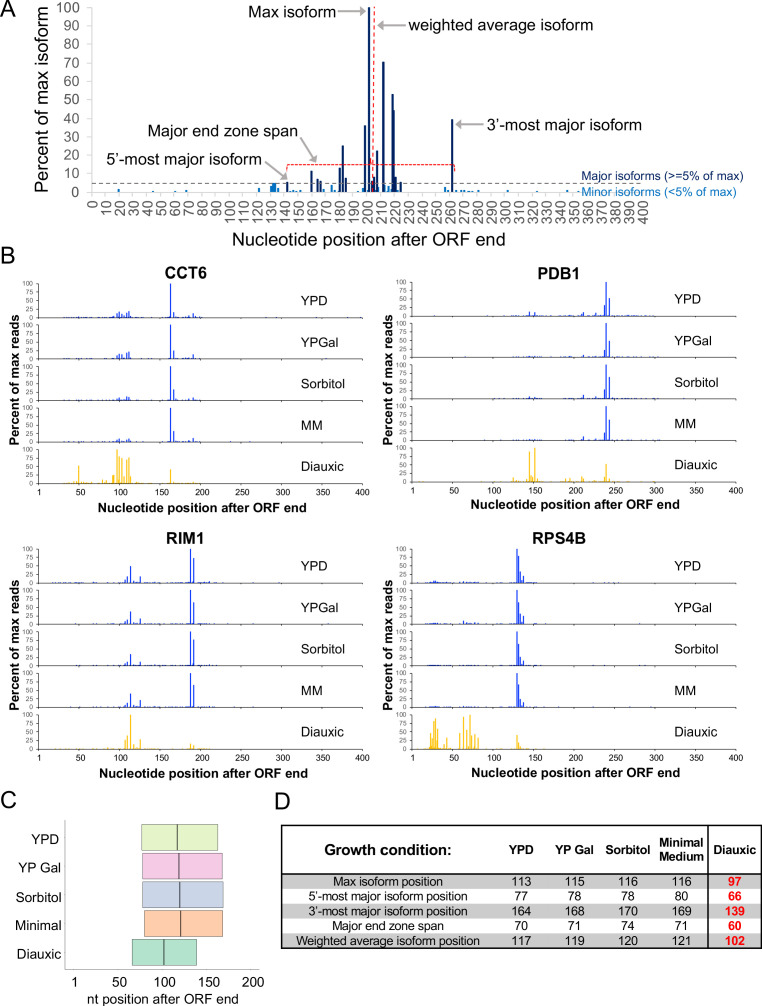
Figure 1. Poly(A) sites are shifted upstream in diauxic cells.
(A) Representative end zone profile (histogram of isoform frequencies) with key landmarks indicated. (B) End zone profiles for four genes under five growth conditions. (C) Major end zone under five growth conditions. Boundaries represent median values genome-wide for 5’-most and 3’-most major isoforms, and the vertical line within the major end zone represents the genome-wide median of the weighted average isoform position. (D) Table of statistics for landmark positions under five growth conditions. Numbers are the median values across genes with a combined read count of at least 1000 in both replicates in every condition. Numbers in bold red are shifted upstream from WT in a statistically meaningful way (p < 0.01).


