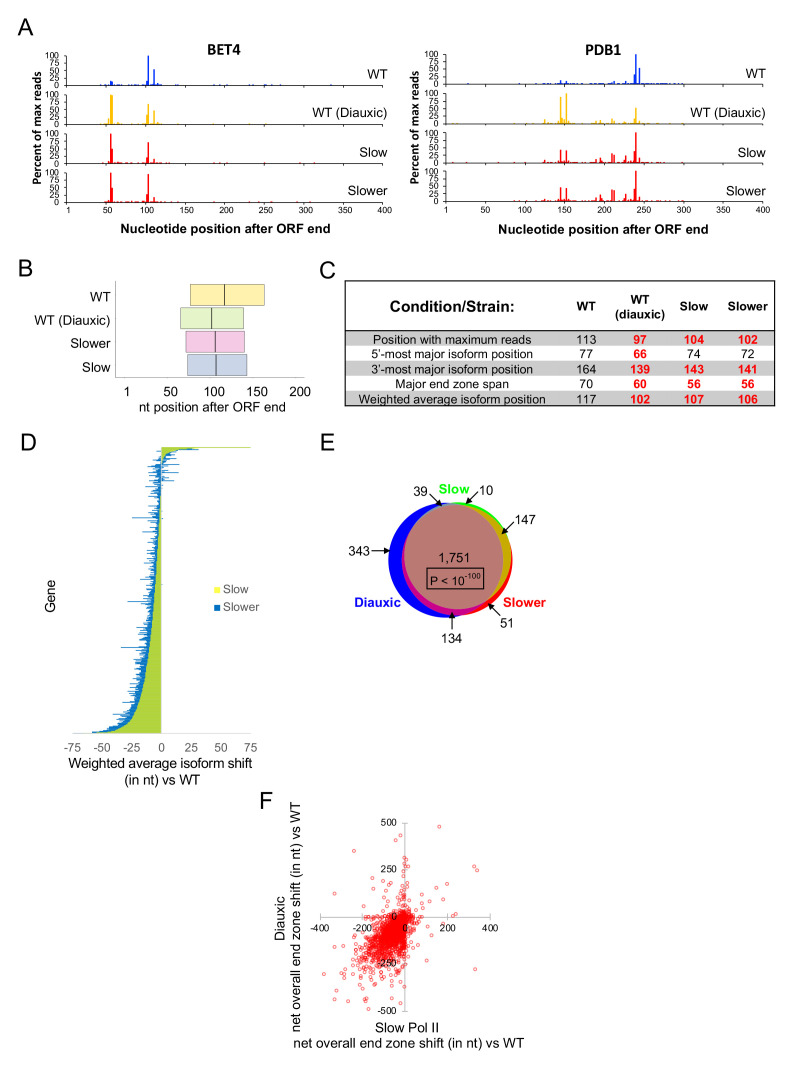
Figure 2. Slow Pol II and diauxic end zones are highly similar.
(A) End zone profiles for PDB1 and BET4 in strains harboring wild-type Rpb1 (in exponential and diauxic growth conditions), Rbp1 H1085Q (‘slower’), and Rpb1 F1086S (‘slow’). (B) Major end zones of these strains. Boundaries represent median values genome-wide for 5’-most and 3’-most major isoforms, and the vertical line within the major end zone represents the genome-wide median of the weighted average isoform position. (C) Table of statistics for landmark positions. Numbers are the median values across genes with a total of at least 1000 sequence reads in both replicates in every condition. Bold red numbers are shifted upstream vs WT in a statistically meaningful way (p < 0.01). (D) Bar graph representation of each gene’s net shift in weighted average isoform position in strains with slow vs wild-type Rpb1. Each horizontal line represents one gene, ordered by shift values in the ‘slow’ strain; the graph includes 3497 genes with a combined read count of at least 1000 for both replicates in all three strains. Yellow bars represent the 'slow' strain, and blue is for the 'slower' strain; overlapping bars appear green. To obtain net shift values for every gene in each mutant strain, the average shift vs WT in two replicates was diminished by the absolute value of the average shift of the WT and mutant biological replicates. The net shift was set to zero if the absolute value of the shift vs WT was less than the absolute value of the shift between biological replicates. (E) Venn diagram overlap of genes categorized as upshifted in the diauxic condition, slower Rpb1 (H1085Q), or slow Rpb1 (F1086S) strains. (F) Correlation of end zone shifts in diauxic and slow Pol II strains. The average net overall end zone shift in slow Pol II strains (x-axis; see Materials and methods) is plotted against the net overall end zone shift in diauxic cells (y-axis). Negative values represent upstream shifts, and positive values indicate downstream end zone shifts.


