FIG. 2.
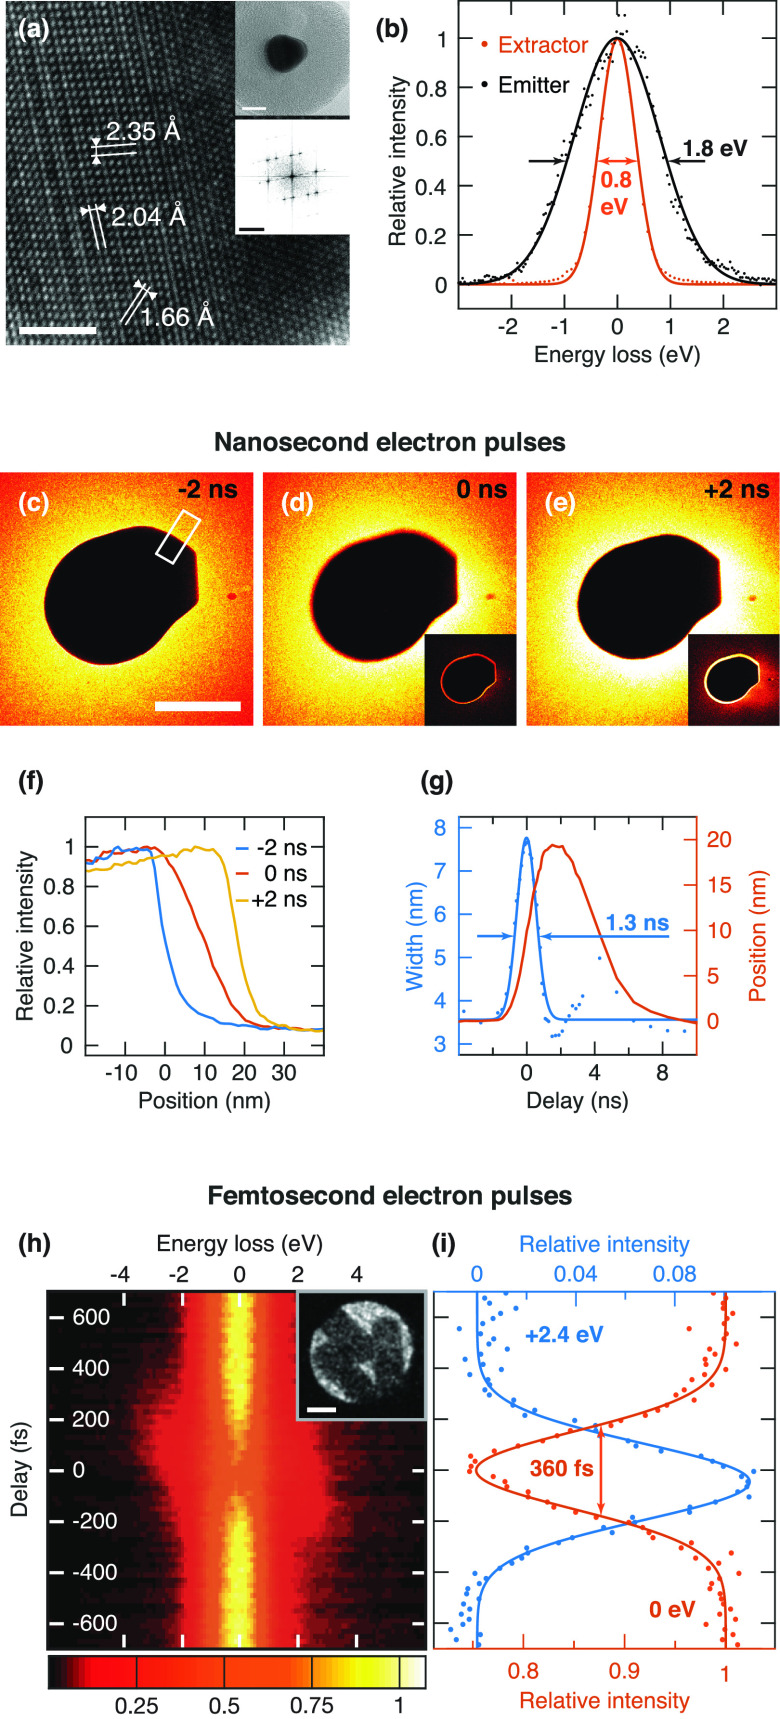
Characterization of the spatial, energy, and temporal resolution. (a) High resolution image of the core of the gold-core silica-shell nanoparticle shown in the top inset. The bottom inset displays the corresponding diffractrogram. Scale bar, 2 nm (10 and 5 nm−1 in the insets). (b) Energy distribution of photoelectrons from the filament and the extractor. Gaussian fits (solid lines) yield a FWHM of 1.8 eV and 0.8 eV, respectively. (c)-(e) Determination of the duration of nanosecond electron pulses from images of a gold nanoparticle under irradiation with a femtosecond laser pulse at different time delays. The insets display the difference with the image at negative time delay. Scale bar, 100 nm. (f) Intensity profiles of the boundary of the particle for different time delays, calculated from the area marked in (c). (g) The width and center position of the particle boundary are determined from a fit with an error function and displayed as a function of time. A Gaussian fit of the width yields an electron pulse duration of 1.3 ns. [(h) and (i)] Determination of the duration of femtosecond electron pulses. (h) Temporal evolution of the energy loss spectra collected from an ensemble of gold nanorods (inset) under femtosecond laser irradiation. Scale bar of the inset, 50 nm. (i) Relative intensity of the zero loss peak (0 eV, red) and of a sideband (+2.4 eV, blue) as a function of time (2 eV integration window). Gaussian fits (solid lines) yield a FWHM of 360 fs, corresponding to an electron pulse duration of 320 fs.

