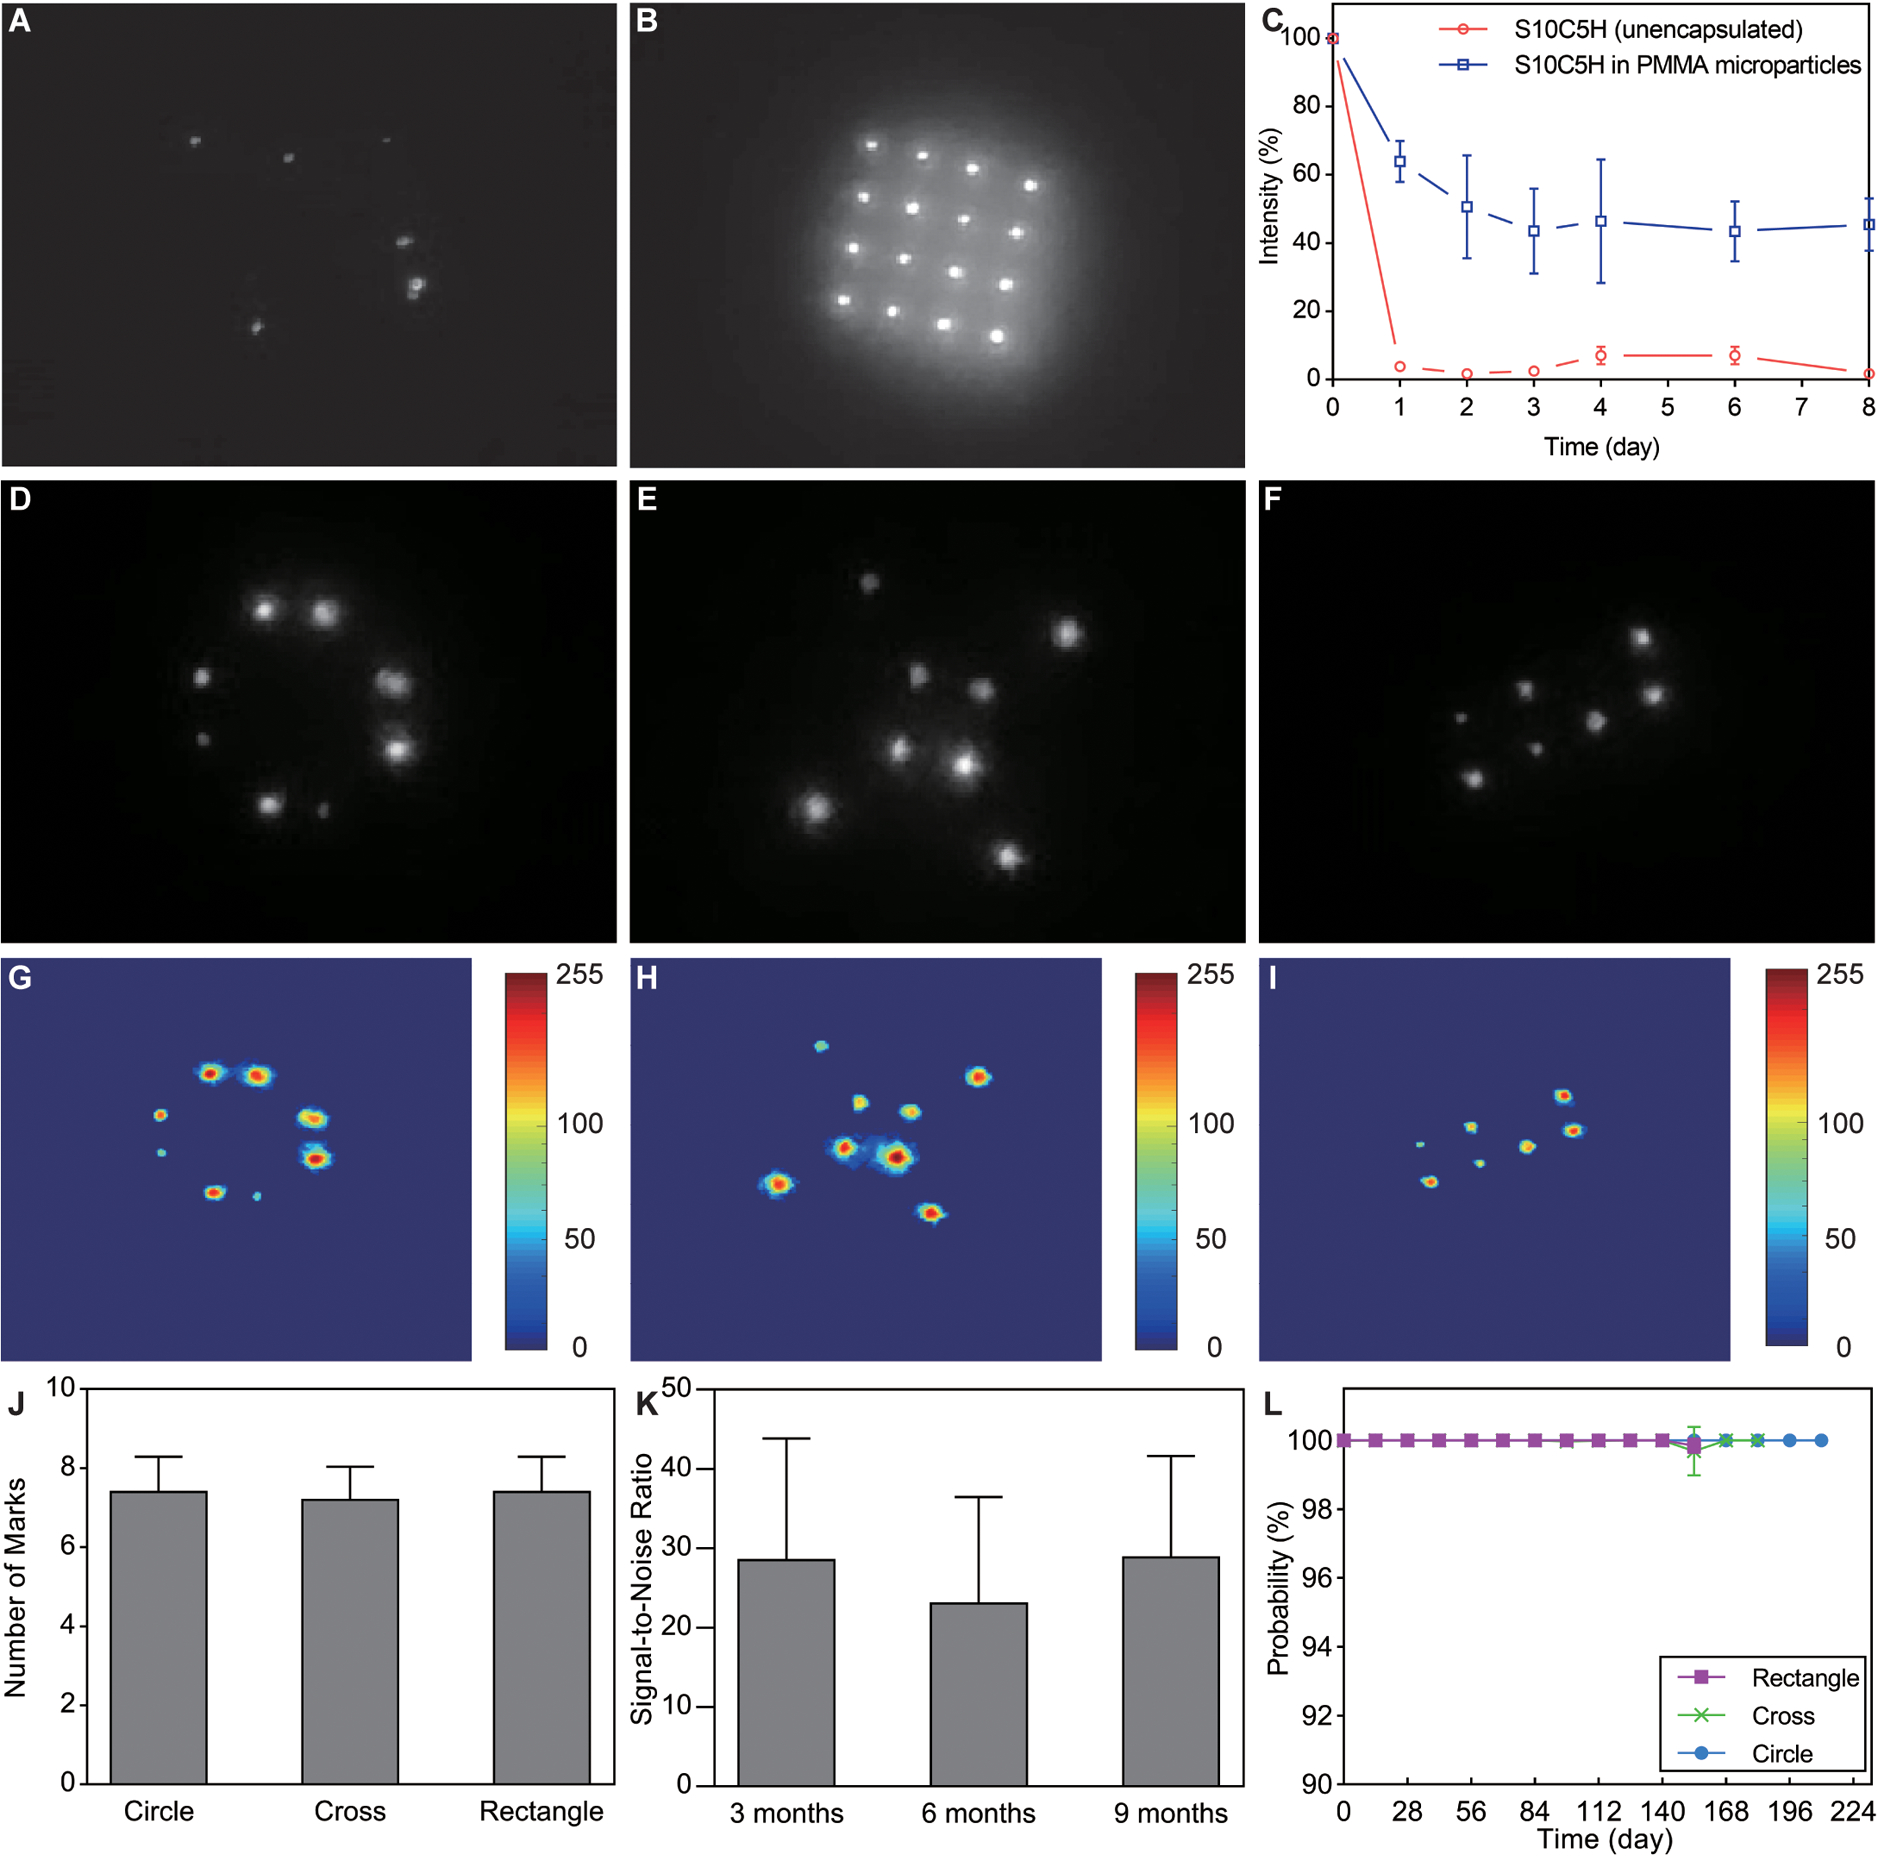
Fig. 5. In vivo imaging of NIR patterns in rodent skin.

Administration site after the delivery of a 4×4 microneedle patch containing (A) unencapsulated QDs or (B) PMMA-encapsulated QDs. (C) Short-term study of signal intensity after microneedle application of unencapsulated or PMMA-encapsulated QDs to rat skin, n=4. Images of (D) circle, (E) cross, and (F) rectangle patterns imaged 24 weeks after administration of PMMA-encapsulated QDs to rats. Log-scale color maps of the same (G) circle, (H) cross, and (I) rectangle patterns shown in (D-F). (J) Number of markings detected 24 weeks post-administration, n=5. (K) Quantification of signal-to-noise ratio for the circle pattern showing no changes between 12, 24, and 36 weeks, n=15 (one-way ANOVA with Tukey’s multiple comparisons). (L) Graph showing the average probability of the machine learning algorithm (all patterns correctly detected), n=5. Grayscale images extracted from red channel of the adapted smartphone-generated RGB image.
