
Figure 4.
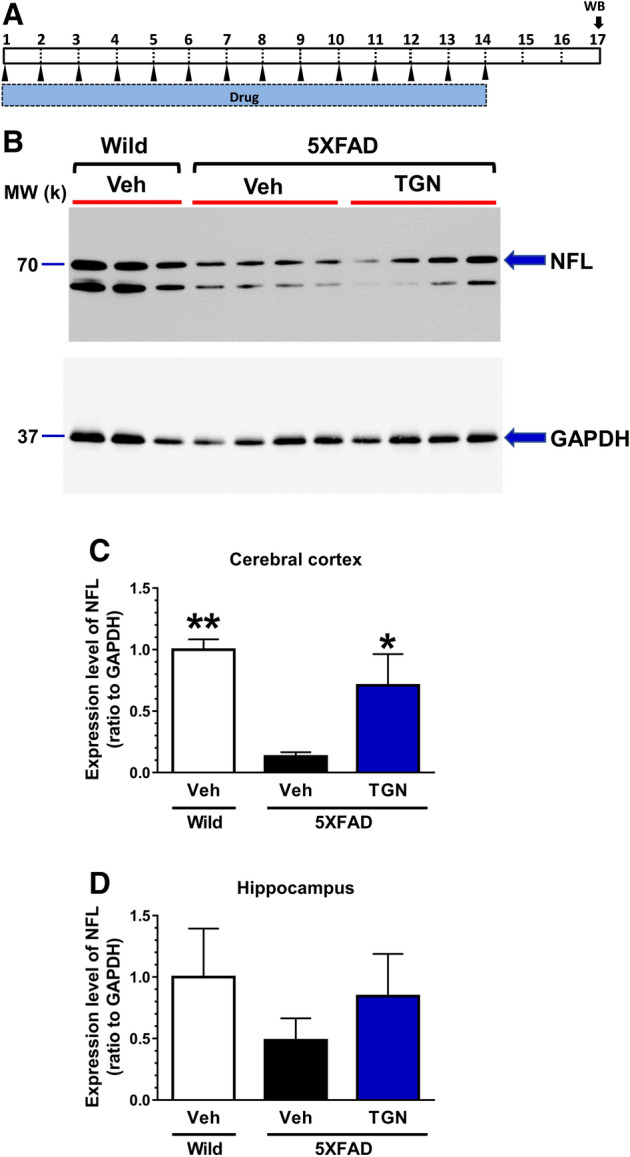
Effects of trigonelline (TGN) on neurofilament light (NFL) levels in the brain. (A) Time course of the experiment. (B) Representative NFL expression in the cerebral cortex by western blotting. Bands at 70 k were quantified as NFL according to the manufacturer’s datasheet. As a loading control, glyceraldehyde-3-phosphate dehydrogenase (GAPDH) expression was also measured. (C,D) Quantitative values of the expression levels of NFL (ratio to GAPDH) are shown for the cerebral cortex (B) and hippocampus (D). The statistical analysis was performed using a one-way analysis of variance (ANOVA) and post hoc Dunnett’s test, *P < 0.05, **P < 0.01 versus Veh-treated 5XFAD mice, n = 6–7 mice.