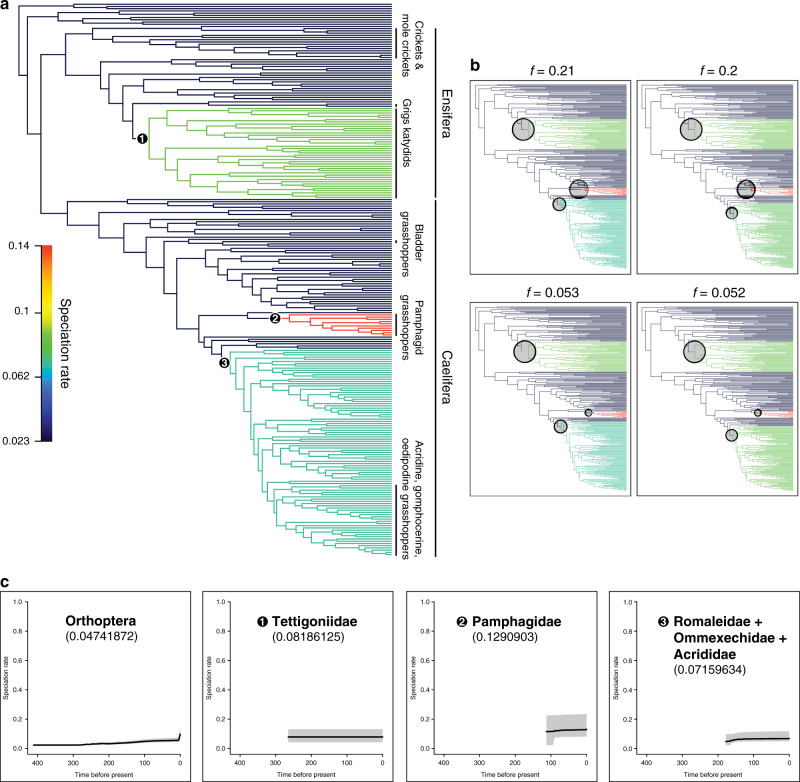
Fig. 5. Bayesian analysis of macroevolutionary mixtures for Orthoptera.
The ultrametric tree used in this analysis is the dated phylogeny based on the combined data (Dnt,trans+mito,strict). a Phylorate plot showing speciation rates (cool colours = slow, warm = fast; specific rate range shown in the vertical colour legend) along each branch of the Orthoptera phylogeny. The three clades indicated by the black circled nodes are the clades with increased rate shifts. Lineages that show acoustic communication are indicated with vertical lines near the terminals. Branches are coloured according to the rate shifts. b About 95% credible sets of macroevolutionary shift configurations. f value of 0.21 indicates that 21% of the samples in posterior can be assigned to shift configuration shown in the upper left plot. These four shift configurations collectively account for 51.5% of the posterior distribution. c Clade-specific evolutionary rate variation through time for Orthoptera and the three lineages identified to have rate shifts.

