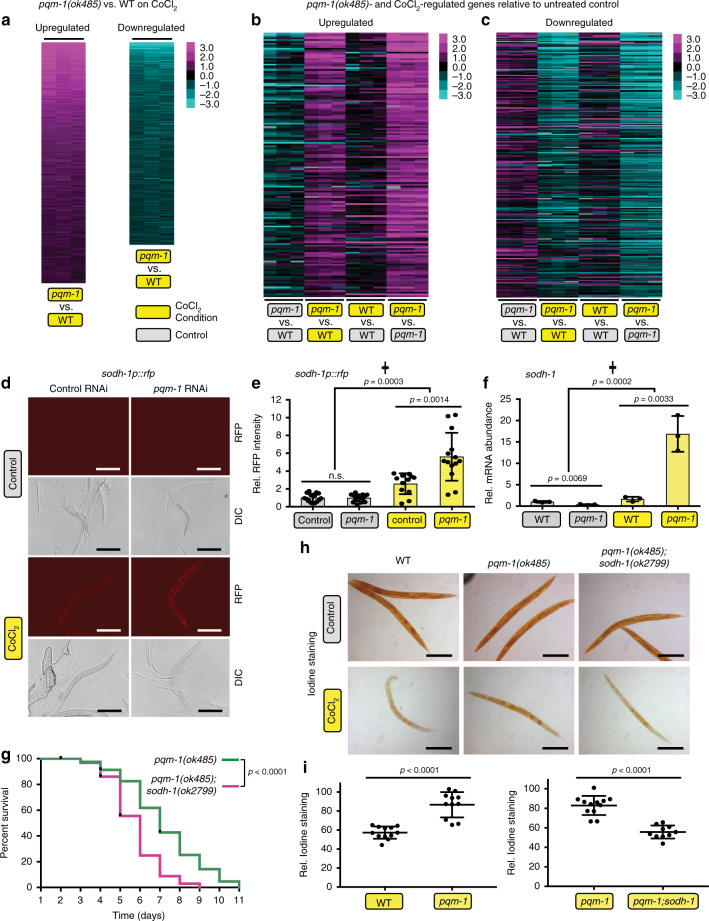
Fig. 2. Glycogen metabolism is altered under hypoxia via PQM-1’s regulation of sodh-1.
a One-class SAM analysis of gene expression changes in pqm-1(ok485) mutants +CoCl2 versus wild type (WT) +CoCl2 identified 1650 upregulated and 629 downregulated genes (Supplementary Data 2). b, c pqm-1- and CoCl2-dependent upregulated (b) and downregulated genes (c). Two-class SAM of pqm-1(ok485) +CoCl2 versus WT +CoCl2 compared to untreated pqm-1(ok485) versus untreated WT identified 152 upregulated and 243 downregulated genes (Supplementary Data 3). Heat maps depict individual genes (rows) ranked by SAM score (median FDR < 0.01), with columns representing individual microarrays (a–c). Animals were exposed to 5 mM CoCl2 for 6 h at early adulthood (a–c). d sodh-1p::rfp reporter activity after 20 h of 5 mM CoCl2 exposure at a late larval (L4) stage; e quantification of reporter activity in (d); empty-vector control (n = 15) and pqm-1(ok485) (n = 16) without CoCl2 (gray bars); empty-vector control (n = 12) and pqm-1(ok485) (n = 14) +CoCl2 (yellow bars); three independent experiments. f pqm-1- and CoCl2-dependent expression changes of endogenous sodh-1 determined by RT-qPCR (n = 3 biological replicates) following 5 mM CoCl2 exposure for 6 h at early adulthood. Two-tailed t-test and Two-way ANOVA (✝) (e, f), mean ± SD, ns = not significant. g Survival analysis of pqm-1(ok485) (n = 67) and pqm-1(ok485);sodh-1(ok2799) mutants (n = 72) exposed to 5 mM CoCl2 at the L4 larval stage. Log-rank analysis (two-sided). Three independent experiments were performed. h, i Glycogen levels of worms subjected to 5 mM CoCl2 followed by iodine vapor staining (h); i quantification of glycogen levels in (h); wild type (n = 12), pqm-1(ok485) (n = 11 [left in (i)], n = 12 [right in (i)]) and pqm-1(ok485);sodh-1(ok2799) mutants (n = 10). Scale bars: 200 µm (d, h). Two-tailed t-test, mean ± SD; three independent experiments.

