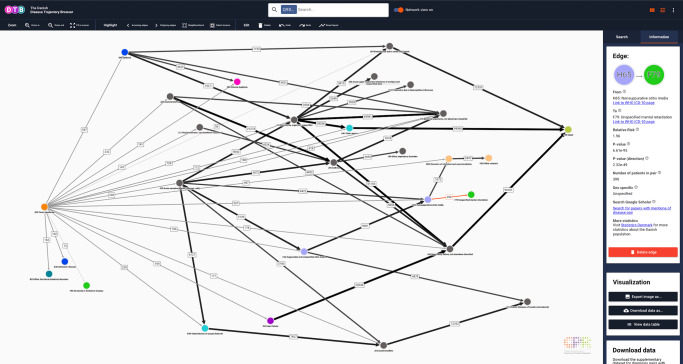
Fig. 3. Network view representation of the linear disease trajectories for Down Syndrome (Q90).
Nodes represent ICD-10 codes and each colour corresponds to one of the 21 chapters in the ICD-10 index. Five chapters are excluded (for details, see Methods section). Arrows represent a statistically significant directionality between two diagnosis codes. Numbers describe how many patients follow the trajectories. If an edge is selected manually by clicking (red highlight) the statistical specifications will be displayed in the side panel. In the visualisation interface, selected nodes and edges may also be deleted (grouped or individually) by clicking on the icon “Delete edge”. A description of each variable can be retrieved by placing the curser over the question marks. Search filter settings: all patients, length 3–5, relative risk (RR) 1.5–361, number of patients 21–114,099. ICD-10 International Classification of Diseases, 10th Revision. Colours of nodes represent ICD-10 chapters.

