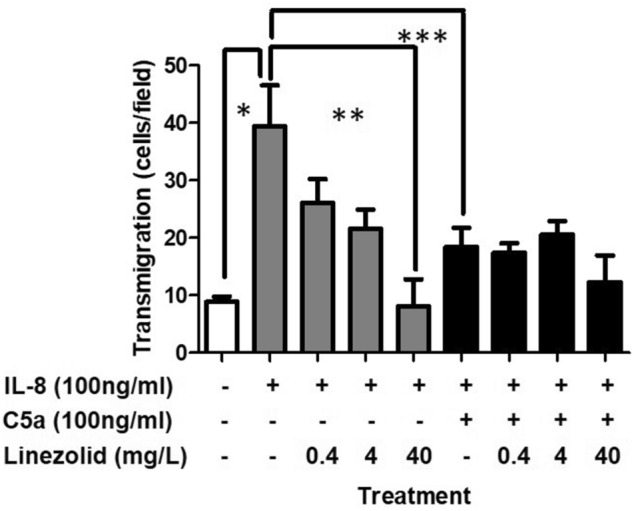
Figure 4.

Effects of linezolid on functional and dysfunctional neutrophil IL-8 induced transmigration. Grey and black bars represent functional and dysfunctional neutrophils, respectively. Data expressed as the mean ± SEM of 4 separate experiments. *Represents a significant difference between the transmigration of functional and dysfunctional neutrophils. **Represents a significant difference between the transmigration of neutrophils treated with linezolid (40 mg/L) and those without.
