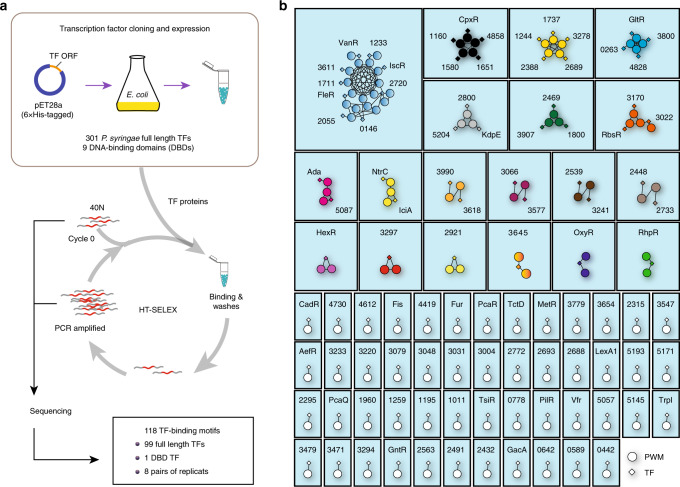
Fig. 1. Network representation of the similarity of the PWMs from the HT-SELEX assay.
a Schematic description of protein expression and high-throughput SELEX process. b Network of similarity of the obtained PWMs. Diamonds indicate TF genes, and circles indicate individual PWMs. Edges are drawn between a TF and its PWM models, and between similar PWM models (SSTAT similarity score >E-05). The TFs without names are named with their locus tag omitting PSPPH_. TF transcription factor, PWM position weight matrix. See also Supplementary Fig. 1, Supplementary Data 1, Supplementary Data 3, and Supplementary Table 1.

