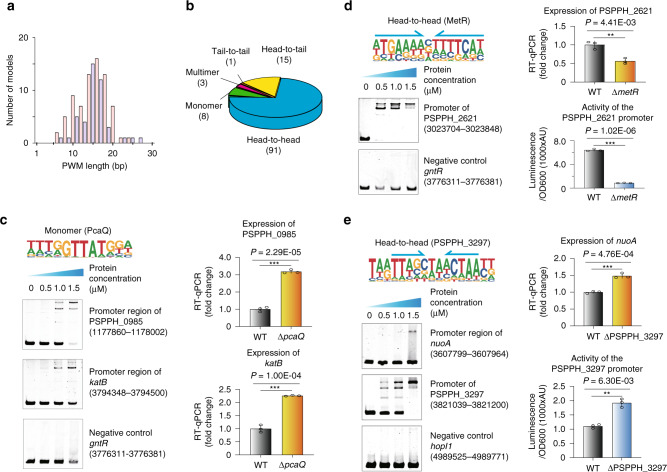
Fig. 2. Validation of different TF-binding modes.
a Histogram shows the distribution of PWM model lengths. Note that TFs prefer even (red) over odd (blue) lengths due to more dimeric motifs, and that the specificity of most PWM length shows ~15 bp. b Pie chart shows the category of different TF-binding modes. Classification of all binding models into non-repetitive sites (monomer), and sites with two or three similar subsequences (dimer and multimer, respectively). The dimeric types are further classified as head-to-head, head-to-tail, and tail-to-tail. c Validation of the binding of PcaQ by EMSA and RT-qPCR. The putative binding sites from the promoter of target gene PSPPH_0985 and katB were verified using EMSA, respectively, and a fragment taken from the gntR promoter was used as the negative control. The expression of target gene PSPPH_0985 and katB was measured in wild-type and pcaQ mutant (∆pcaQ) by RT-qPCR, respectively. Logo shows the binding site model of PcaQ. d Validation of the binding of MetR by EMSA, RT-qPCR, and a reporter assay. The binding site from the promoter of target gene PSPPH_2621 was verified using the EMSA, and a fragment taken from the gntR promoter was used as the negative control. The expression of target gene PSPPH_2621 was measured in wild-type and metR mutant (∆metR) by RT-qPCR. The promoter activity of target gene PSPPH_2621 was evaluated in wild-type and metR mutant by the reporter assay. Logo shows the binding site model of MetR, with its monomeric half-sites indicated with arrows. P value is 4.410E-03 (upper). P value is 1.017E-06 (lower). e Validation of the binding site of PSPPH_3297 by EMSA, RT-qPCR, and a reporter assay. The putative binding sites from the promoter of target gene nuoA and PSPPH_3297 were verified using the EMSA, respectively, and a fragment taken from the hopl1 promoter was used as the negative control. The expression of target gene nuoA was measured in wild-type and PSPPH_3297 mutant (∆PSPPH_3297) by RT-qPCR. The promoter activity of target gene PSPPH_3297 was evaluated in wild-type and PSPPH_3297 mutant by a reporter assay. Logo shows the binding site model of PSPPH_3297, with its monomeric half-sites indicated with arrows. P value is 4.760E-04 (upper). P value is 6.300E-03 (lower). Statistic P values by two-tailed Student’s t test are shown; *P < 0.05, ***P < 0.001 (c–e). Three independent biological replicates were performed (c–e). Error bars show standard deviations. TF transcription factor, PWM position weight matrix. Also see Supplementary Figs. 2, 3, and Supplementary Data 4.

