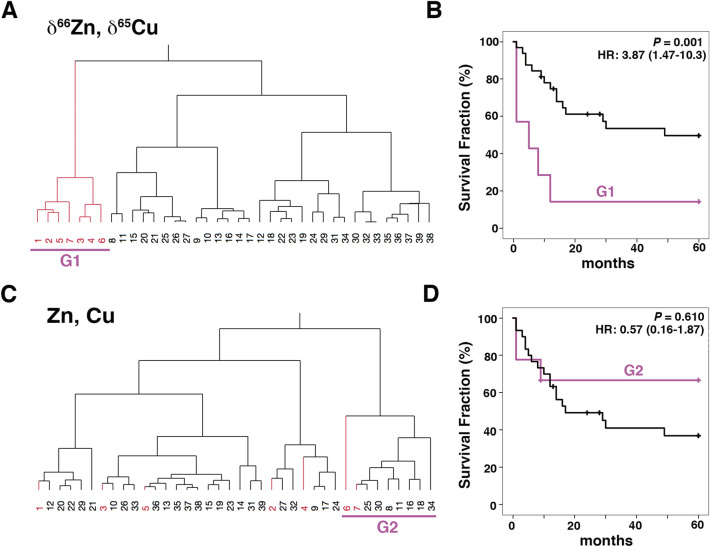
Figure 4.
Survival analysis based on the combination of δ65Cu and δ66Zn values. (A) Hierarchical clustering analysis classified HM patients into two groups (G1 and the other group) using the δ65Cu and δ66Zn values. (B) Survival curves for G1 and the other group obtained by Kaplan-Meier analysis. G1 showed significantly poor survival from the early phase (P = 0.001). (C) Similar classification as in (A), but using the corresponding Cu and Zn concentrations. (D) HM patients were classified into two groups (G2 and the other group). Survival curves for G2 and the other group obtained by Kaplan–Meier analysis. The two groups did not show a significant difference. Patients are numbered according to the δ66Zn value (descending order); red coloured numbers correspond to patients in G1; HR, hazard ratio with 95% confidence interval.

