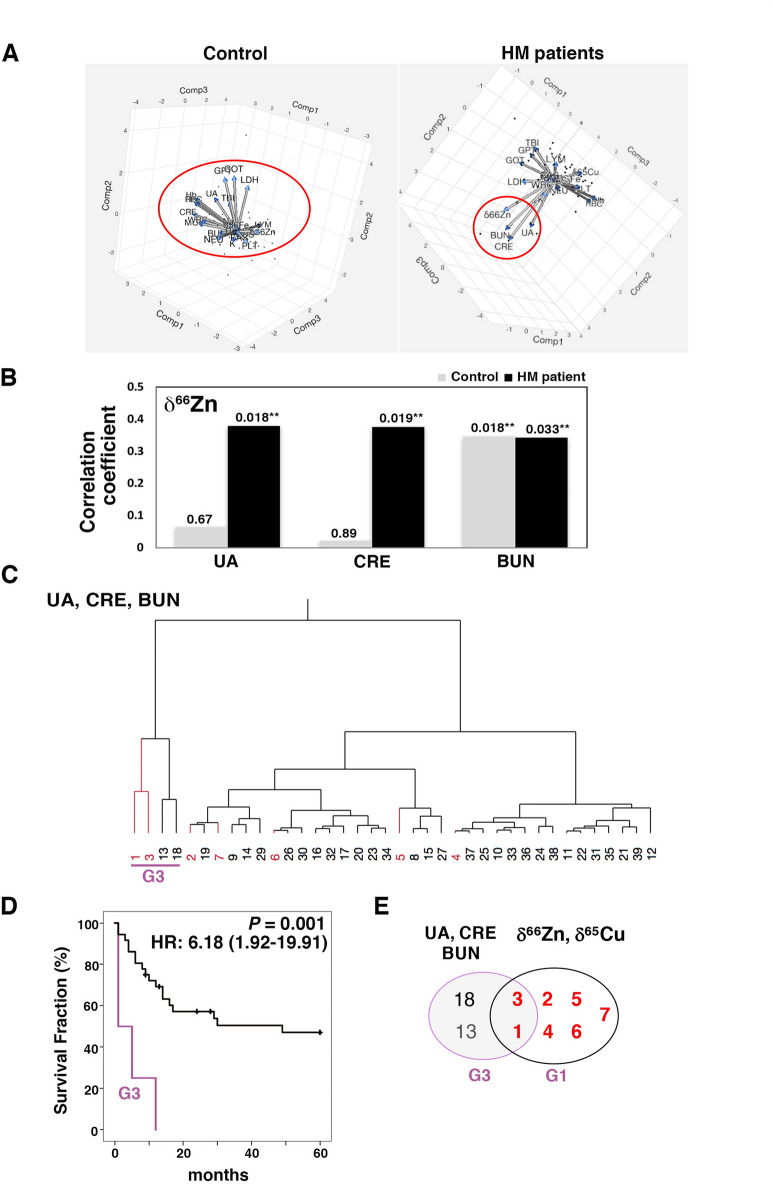
Figure 5.
Correlations between the isotopic compositions and laboratory test values. (A) Principal component analysis (PCA) using the isotopic compositions and laboratory test values. PCA was performed using JMP (version 13.2.0, SAS Institute inc., Cary NC, USA). The red circle indicates a characteristic distribution of items in controls or HM patients (Adobe Photoshop CC, version 18.1.6, Adobe System Inc., CA, USA). (B) Correlations between the Zn isotopic composition and renal function parameters. The values above the bars correspond to the P-values for each correlation. Black bars: values for HM patients; grey bars: values for healthy controls, *P < 0.05. (C) Hierarchical clustering analysis using UA, CRE, BUN (renal function) classified HM patients into two groups (G3 and the other group). (D) Survival curves for G3 and the other group were obtained by Kaplan-Meier analysis. All patients in G3 died within 15 months, and G3 showed a significantly poor survival (P = 0.001). (E) Venn diagrams illustrating the partial overlap between G3 and G1. Two patients in G3 were also included in G1. Patients are numbered according to the δ66Zn value (descending order); red coloured numbers correspond to patients in G1. HR, hazard ratio with 95% confidence interval.

