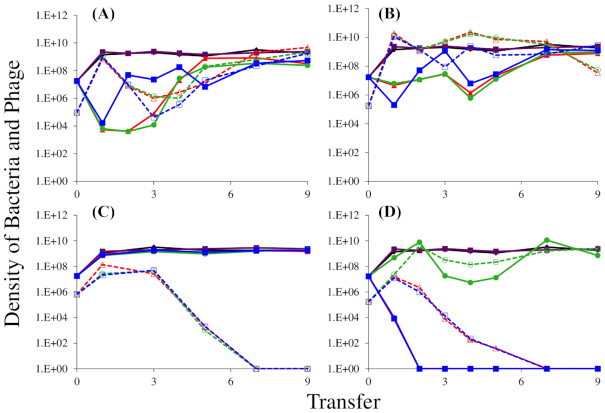
Figure 1.
The population dynamics of T3 (A), T4 (B), T5 (C) and T7 (D) phage with wild-type E. coli MG1655. Cultures were diluted 1:100 into fresh LB medium every 24 h; three replicates were performed per condition. Solid lines show bacterial densities in each replicate (red/green/blue); dotted lines show the phage densities in the corresponding cultures. Phage-free cultures (black and purple lines) are shown as controls, to indicate resource-limited population size for the bacteria.

